In the summer of 2012, CenterPoint Energy completed a multiyear project to install 2.3 million smart meters throughout the utility’s 5,000-sq-mile (12,950-sq-km) electric service territory in Houston, Texas, U.S. These meters, which automatically send notifications about power outages, are the foundation of the intelligent grid CenterPoint Energy has spent years — and more than US$130 million — designing and constructing.
Thanks to smart meters and other elements of the intelligent grid, CenterPoint Energy receives a flood of data elements every day. Prior to the smart grid, the utility would conduct 29 million meter reads per year. Now the utility receives and processes hundreds of millions of automated meter reads per day as well as hundreds of thousands of real-time signals from meters. As a result, the amount of data the utility maintains has risen 83%.
However, what benefit could come from having a mountain of data pouring into the utility’s operations computers on a daily basis? How could anyone sift through so much information and interpret meaningful facts in time to put them to practical use?
CenterPoint Energy’s distribution control operations needed the ability to see a programmatic and graphic representation of power outages and crew locations in near real time to ensure distribution reliability. The team was drowning in data, presented with a vast amount of information from various programs, and needing to bring all the key data together.
From Data to Information
A lifeguard showed up in the form of CenterPoint Energy’s operational and corporate analytics group. Working closely with the distribution control operations group, and partnering with analytics services company Treverity, the group assessed the need and developed Treverity EDGE, a software solution that correlates and analyzes the ocean of continuously updating information and translates it into invaluable situational awareness. The result has been a new approach in massing data into near-real-time views that produce measurable results in critical areas affecting reliability, customer satisfaction and revenue forecasting.
This data analytics system, which quickly and accurately reflects how the distribution system is operating in near real time, makes CenterPoint Energy’s intelligent grid possible. One goal of this system is to analyze the millions of pieces of data that are not working together into an integrated system to enable better operational decisions and control in all conditions.
How to Make It Work
To develop CenterPoint Energy’s data analytics, the team observed their distribution control operations colleagues coordinate outage restoration work during three major storms over the past three years. Working together, they made incremental changes to the system model during a live event. Monitoring moments during storms when people need to access other systems for random data points allows for immediate identification of deficiencies in viewable data in near real time. When monitoring people who are managing a storm, it is important to ask them what they are looking for and where it is located. Once a need is identified, it can be placed in a live feed to avoid spending valuable minutes trying to mine the data point during a critical event.
The distribution control group needed an adaptable system, a software solution built for change. The analytics team worked from the ground up, starting with the idea everything in the environment is constantly changing: crews are deployed across the utility’s electric service territory, working to restore power while new outages are coming in. Distribution control needed to see what was going on at any given moment and put itself in the best possible position to deal with whatever would happen the next minute. Information is the key to making the right decision. The sooner the right information can be obtained, the sooner a decision can be made in a continuously changing arena.
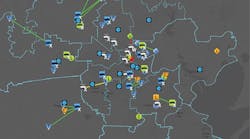
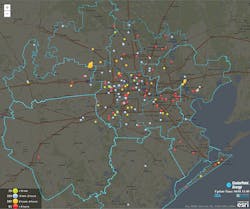
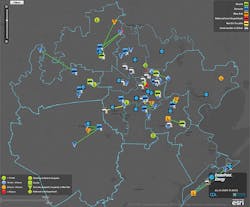
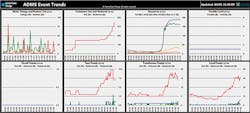
The analytics team responded by developing the Treverity EDGE platform, which can sift through and evaluate information more quickly than a human can by determining which of these millions of data points is out of the ordinary and displaying that information on screens for everyone involved in the process. Those screens display outage information updated every five minutes. Now that this technology has been deployed across the utility, everyone involved in the process — from linemen to executives — can see how the system is performing minute by minute. These visual displays have helped to answer the questions every operations center asks: Where am I? What is my status? What is my next best action?
Affecting Outcomes
Operations is now equipped to affect the outcome rather than merely responding to a storm. Instead of searching through pages of screens to determine where the trouble is and where the crews are, the distribution control group members now have the answers right in front of them, as well as a prediction of where crews will be needed in one hour.
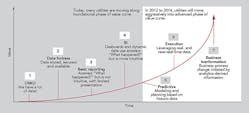
Historically, data usually was rendered in a static concept. Batch reports were run against a standard group of data sets, rendering a collection of information that represented the situation as it was at a particular moment. This process did not identify what was currently happening. It relied solely on reacting to data sets that might have been hours old.
With CenterPoint Energy’s new platform, data is seen as a dynamic stream of information. Each situation or storm is different, affecting individual areas of the system or the entire system. Sometimes it is heavy wind damage that needs a massive response from field crews; other times it is rain, with less physical damage to the system, which calls for a different level of response. Each event and all data points associated with it need to be seen live to respond in the manner needed for that situation at that moment. Storms are not static, so why use static data?
Adjusting Data and Display
CenterPoint Energy’s new analytics platform adjusts the types of data it is pulling as well as the displays it is providing to the control room. As storm systems enter the territory, they are assigned a trouble level based on the damage they are causing. As the trouble level increases, the screens shift to reflect the specific data requested by the control room.
The system also can predict, based on time-test calculations, where resources will be needed and which crews will be available in 30 minutes and in one hour. Thus, incoming crews can be sent, or currently engaged crews reassigned, to the areas being hit, reducing idle time for field crews waiting for a decision on where they will be sent next. Based on trouble level, the system automatically notifies critical personnel, including executives, by e-mail as warranted to mobilize resources.
The analytics program has led to a more uniform, collaborative way to deal with the effects of a storm. Now everyone sees the same information in the context of their own role and overall conditions, allowing multiple sets of eyes to turn data into actionable insight. For example, situational awareness displays also are available to the utility’s customer service representatives, enabling them to keep customers more accurately informed about the status of outages in their neighborhoods.
Only a few years ago, distribution control operations managed major power outage events by monitoring the location and status of line technician crews as they responded to possibly thousands of outages. In contrast, the data analytics system pulls information in real time, prioritizes it according to its SAIDI impact and presents it in a clear format that enables quicker response and more efficient use of manpower.
Data analytics can help to correlate the type of trouble with the closest crew available that has the skill set needed to deal with that trouble and project how many crews will be available to respond to further trouble in both 30 minutes and one hour. This enables the proper staging and movement of crews to ensure the entire system receives the resources to deal with the current level of trouble, which results in huge savings in truck rolls, man-hours and outage durations.
Since deploying data analytics, CenterPoint Energy has seen measurable reductions in the number of minutes its electric customers are without power. Since 2011, the utility’s intelligent grid has saved customers more than 100 million outage minutes, and in 2014, electric reliability improved by 32%.
The Discipline of Analytics
Data analytics is having a major impact on CenterPoint Energy in other ways, as well, from faster detection of electricity theft to improved revenue forecasting. A wide range of other possible applications appears likely for data analytics, which is far more than simply a technology solution. Data analytics is emerging as a discipline, a method that can be applied over and over to translate data in any form into actionable information for a multitude of automated business solutions. For CenterPoint Energy, which now analyzes hundreds of millions of data points each day, big data is not that big anymore.
Bill Bell ([email protected]) has served as technology director of operational and corporate analytics for CenterPoint Energy since 2011. He is responsible for formulating strategy, road maps and vision that target how technology operations and the business areas are partnering to form operational and corporate analytics. Previously, he served as the utility’s technology director for the advanced metering system intelligent grid program management office. Bell is a certified project and program manager, and a 2014 and 2015 IBM Champion. He holds a BBA degree from the University of Texas at Arlington and a juris doctor degree from the University of Houston.
Ricky Orum ([email protected]) has served as director of CenterPoint Energy’s distribution control operations for the past five years. His responsibilities include distribution-level switching (proactive and reactive), dispatch and other items related to distribution grid operation. He has served in numerous roles in both gas and electric operations areas over his 23 years with CenterPoint Energy. He has undergraduate and graduate degrees from Sam Houston State University.
