Over the last 10 years, Maquoketa Valley Electric Cooperative (MVEC) has been able to reduce its outage hours by 37% using technology. Many of the cooperative’s systems have been in place for more than a decade, but recent efforts to integrate data from its supervisory control and data acquisition (SCADA) system, advanced metering infrastructure (AMI), outage management system (OMS), geographical information system (GIS) and customer information system (CIS) have resulted in service reliability.
MVEC serves 16,000 member-consumers in a 4,500-sq mile (11,655-sq km) service territory. The consumers are served from 37 substations and through 3,300 miles (5,311 km) of distribution line, of which 95% is overhead.
Proactive Instead of Reactive
Historically, electric utilities have been reactive to issues after consumers complain. From power-quality issues to high bill complaints, utilities often have been unaware of a problem until they received a phone call about it.
Technology is helping utilities to turn reactive responses into proactive analyses. With more sensors installed on power lines every day, the challenge becomes this: How does a utility take the data that is coming back and make it useful? These sensors come in the form of more intelligent breakers at substations, in-line devices that provide communications back to the office, two-way electric meters and more.
Each sensor is capable of adding data to a database, so the data starts adding up quickly. MVEC collects more than 110 million data points per year from SCADA and AMI. All of this data does nothing to help utilities operationally if it is not used. So, how do utilities start to make the data work for them?
Dispatch Crews Before Calls
Technology platforms inside the utility become more useful when the systems can communicate with each other. The data that one system can share with the other systems gives a more complete picture of what is happening on the grid.
Before AMI was installed, and 16,000 sensors were added on the power line, MVEC relied on SCADA from Survalent Technologies to attempt to predict outages before consumers called in to report an outage. This was done by analyzing the loading before and after the fault on the substation, feeder and phase to see whether the load had dropped. If so, the feeder model was quickly looked at to see which device could be open with that amount of load beyond. If something matched, a crew would be dispatched to an outage that nobody knew was an outage for sure.
After AMI was installed, the way to predict down-line outages changed. Instead of using a best-guess based on feeder loading and fault currents, on-demand meter pings could be sent through the OMS software, dataVoice International. This allowed for a graphical view of meters that might be out of power by using Cooper Power Systems’ power-line carrier-based AMI.
MVEC showed dataVoice the manual process, and the company helped to automate it by having the OMS continually watch the SCADA system for new faults. When a new fault occurs, dataVoice auto-triggers meter pings by substation, feeder and phase to determine the extent of the outage. Within 2 to 3 minutes of the initial fault, all of the meter ping results are returned and the extent of the outage, if there is one, is known.
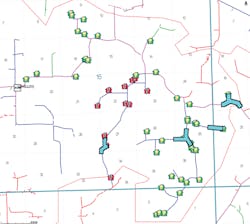
The fault current values recorded by SCADA are compared to the maximum line-to-ground-fault values produced by the engineering model, Milsoft WindMil, using a 0-Ω fault impedance. Any line section where the calculated fault current matches the actual value within ±5% is then highlighted inside the Map Viewer software from Partner Software. The meter ping results also are displayed in the Map Viewer, and the combination of the two systems together helps to accurately predict the location of faults and number of consumers who are out of power.
The combined data from these systems allows MVEC to dispatch crews before consumers call to report they are out of power. In some cases, the power is able to be restored before anyone calls at all. As more people work outside of the home, these outage events are now becoming non-events in their eyes because it does not disrupt their life. Instead of getting home from work at 5 p.m. to realize they are out of power, the power has already been restored. Being proactive helps with customer satisfaction, especially when they do not even realize they were without power.
Voltage Abnormalities
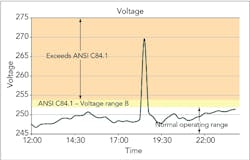
With the installation of AMI in 2008 came the addition of 16,000 individual voltage meters installed across the MVEC system. These meters provide greater opportunities to provide higher quality of service without much additional effort. Using the AMI, voltage on meters can be requested every 15 minutes for strategic services located down-line of voltage regulators to ensure the regulators are operating within the normal operating range.
If the voltage goes too high or too low, text-message alerts are set up to notify key staff of the abnormal voltage. This provides the opportunity to respond to power-quality issues immediately instead of waiting for consumers to call. MVEC does not have an operations center staffed 24/7, so the text messages allow the on-call supervisor to dispatch crews to correct problems when they happen. Previously, similar instances of high voltage could have gone on for extended periods of time before consumers call with concerns.
By requesting voltage of strategic meters, MVEC was able to address groups of meters that experienced high or low voltage, but it did not have a system in place to monitor individual meters that might be affected. In 2010, a MVEC consumer called in to report an increased number of light bulbs burning out. With the use of AMI, the coop was able to identify the consumer had been experiencing the problem for three months before calling in to report it.
To help partial short circuits in transformers from going unnoticed for long periods of time in the future, the utility started to collect the maximum voltage seen by each meter a few times per week. A report is generated that shows the meters affected by high voltage. This report is automatically delivered via e-mail, which helps to ensure it is seen before damage can occur at the consumer’s location.
Predictive Distribution Transformer Changes
Real data coming back from AMI meters means engineering assumptions do not need to be made as often when it comes to transformer loading. The 16,000 meters installed in the field that send back their peak demand and energy usage each day results in about 12 million data points in a database per year. With a little bit of math and some database queries, MVEC is using this data to find overloaded transformers so they can be upgraded proactively, prior to failure.
The process started by looking at IEEE and Cooperative Research Network papers on transformer loading. The issue with applying theses papers is they focus on the winding and oil temperatures, both of which are not routinely monitored on distribution transformers. Instead of basing the change-out decisions solely on estimated temperatures, MVEC decided to look at actual load data from locations that had experienced a transformer burn out as a result of overload so it could develop criteria for AMI data to help predict failures.
MVEC looked at 12 months of transformer change data and analyzed each transformer that had failed as a result of overload. This analysis showed there were common links between the failed transformers that a normally loaded transformer did not have. The combination of maximum demand, average load factor, frequency with which the transformer is overloaded and average demand over one year all point toward the need to change out a transformer.
All of the data needed to run this analysis is brought back and stored from the AMI daily, but analysis needs to be run on the data to help make the decisions. This is the proverbial needle-in-a-haystack report where tens of millions of rows of data need to be sorted through to determine which transformers need to be changed. If the generated list is too long or has too many false positives, it will be ignored by the end user.
By being proactive instead of reactive, MVEC is able to provide better service to the consumers because they will not be out of power during their high-energy usage time, when it is the most inconvenient time to lose power. Being proactive also helps to reduce operating expenses since transformer changes can occur during normal working hours instead of on overtime. This also helps to reduce the number of new transformers that need to be purchased each year to replace units that have failed.
Meter Blink Analysis
Faulty equipment can be detected by evaluating multiple data points stored in independent databases, but finding these potential issues can be much easier if interfaces are configured between the databases that allow the analysis to be automated. Data received from SCADA may not give as full of a picture if it is not compared with OMS data about outages that occurred. Furthermore, if all of this data is tied to the electrical connectivity model from GIS to the AMI, even more detail can be found.
By taking the blink count history from the AMI, it can be cross referenced to the SCADA for known blinks and to the OMS for known outages. If one meter is showing more blinks than other meters that the GIS shows are connected nearby, then there is reason to investigate this meter further. MVEC has found bad meter sockets, faulty meter current transformers, loose hotline clamps and other such anomalies through reports generated from the blink counts gathered daily on all meters.
These issues all affect the electric meter (the cash register) of the utility. Loose meter socket connections can cause heating of the meter and destroy it. Bad current transformer connections slow down or stop the cash register completely. Loose hotline clamps are a power-quality issue. By looking for these types of problems, MVEC can address consumer complaints before consumers call in.
The Next Steps
MVEC has put programs in place over the last 10 years to help control power costs. The collection of more data has enabled the utility to develop and implement these programs. Why not take the data collected on individual meters and help consumers to reduce their power costs, as well? This can be done through web displays of their data or notifications when their usage becomes abnormal compared to their normal usage patterns.
How about tying SCADA and AMI data together with the engineering model to help identify areas with high losses? Is it possible to develop plans down to the substation, feeder and phase level that will help to reduce losses or identify energy theft without additional equipment being needed?
While helping to identify areas where high-energy losses are occurring and helping consumers to manage their electric bills better are admirable thoughts, none of it will happen unless better analytic tools are developed and used. Workloads will need to be shifted for people to have time to look at the data being generated, and an effort to automate as much of the analysis as possible will need to be made.
The shift from being reactive to proactive will not come without intentionally choosing to go in that direction. Adding more equipment to the electric system will not be of benefit unless the utility chooses to make use of the datathat is returned. With hundreds of millions or billions of rows of data being stored for somebody to look at someday, why not start today?
Acknowledgments
This article would not have been able to be written without the efforts of our engineering technical services team: Dean Koopmann, Keith Helmold, Chad Wieser, Tom Paar, Denny Schwebke and Eli Hunerdosse. Their dedication to keeping the systems operating on a daily basis allows for the data to be collected and used to help our consumers have greater reliability.
Mark Scheibe ([email protected]) is the distribution engineering supervisor at Maquoketa Valley Electric Cooperative. He is responsible for the system planning and design, and oversees AMI, SCADA and the GIS and OMS systems. Scheibe holds a BSEE degree from Iowa State University and is a licensed professional engineer in the state of Iowa.
Jeremy Richert ([email protected]) is the director of engineering for Maquoketa Valley Electric Cooperative. He holds a BSEE degree from Iowa State University and is a licensed professional engineer in the state of Iowa.
Editor’s note: This article is based on a presentation given at TechAdvantage.
Sidebar : Missing Data = Swiss Cheese
Data integrity is key when using it for anything engineering related. No matter what system is in place — SCADA, AMI, OMS — there needs to be a verification and validation system to ensure data is not missing.
Using Microsoft SQL, Maquoketa Valley Electric Cooperative has created an three-step data verification and validation process:
- Focus on the communications to the sensors installed. Without a solid communications backbone to the substations and down-line devices, data will not be collected and will become useless.
- Verify that the data expected to come back is coming back through an automated routine. Often, there is not time to manually look for missing data. Set up a way to automate this step through a vendor or custom programs. MVEC uses SQL and Windows PowerShell.
- Validate the data coming back is within acceptable limits. If the data is not acceptable, it is not usable. For example, if a single-phase meter with a 25-kVA transformer reports back a peak demand of 150 kW, it is likely invalid.
Sidebar: Do Not Be Afraid of Mining Data
By Mark Scheibe
When I started at Maquoketa Valley Electric Cooperative (MVEC), I knew how to use Microsoft Excel and how to program VBA macros. It used to take me 4 to 6 hours to write a program to manipulate the data in a way to get the data that was needed. I then learned Microsoft Access, and what had taken 4 to 6 hours took 2 to 3 minutes. After some Access queries started to take 45 minutes to run, the next step was to learn Microsoft SQL. While new programs can be intimidating at first, Google can be used to provide links to cheat sheets for just about any data analysis program to help get an inexperienced user started.
Utility staff (and engineers) should not be afraid to use a tool they are comfortable with to analyze the data themselves. Or, if they realize the tool they are currently using is the wrong tool for the job, they should try a different program with more available features. MVEC IT helped to set up the proper database connections and ensured everything was secure. After that, the engineering department decided what data was needed to complete certain projects.
The more utilities start to use the data, the more ways they will find to use the data.
Companies mentioned:
Cooper Power Systems| www.cooperpower.com
Cooperative Research Network| www.cooperative.com
dataVoice International| www.datavoiceint.com
IEEE| www.ieee.org
Microsoft| www.microsoft.com
Milsoft| www.milsoft.com
MVEC| www.mvec.coop
Partner Software| www.partnersoft.com
Survalent Technologies| www.survalent.com


