Why Asset Management Leads to More Tree-Caused Interruptions – Part 2
In the first part of this series I made the argument that Asset Management leaning on outage statistics, which are a trailing indicator, will lead to increasing tree-related outage incidents. The graph I provided makes it apparent that by the time you perceive a clear trend in increasing tree-related outages the VM program is substantially behind. Allowing the VM program to fall behind, ultimately, results in greater expenditures while having delivered a sub-standard service. While I believe outage statistics provide the quintessential measure of the success or failure of the VM program; that they serve to identify areas where a new problem has emerged but that they are next to useless as an indicator for routine pruning work.
You may disagree and I’m willing to change my mind. I will, however, need to see solid data in the form I provided in the first article showing that the cumulative work due occurs far more slowly. That is to say that instead of all sites breaching the limit of approach in eight years, that point is not reached for at least 16 years. I don’t hesitate to say prove me wrong because obtaining this type of data will lead to more informed decisions. If I’m wrong, it will provide you with a clear-cut means of communicating and justifying your VM choices. If I’m right it will serve to guide your VM program to deliver greater reliability for less cost.
Here’s another reason why you should collect data and model when trees will breach the limit of approach. The data will provide clear guidance on the optimum length of the pruning maintenance cycle. I can’t count the number of times I’ve encountered regulators questioning the length of the maintenance cycle and that suggests that utilities are not collecting the data necessary to inform themselves and their regulators. So let’s look at what I think would settle the question of choosing and justifying a utility’s pruning cycle.
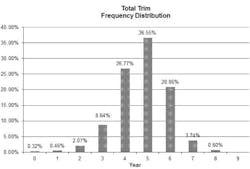
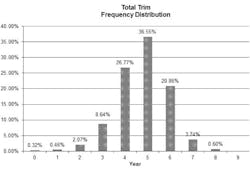
The cumulative graph provided in the first part of this series is really the cumulative result of a frequency distribution which is presented here.
Before we examine that graph let me make clear how I define a maintenance cycle. A maintenance cycle is the period between full patrols. If we take a circuit as the unit, the entire circuit is patrolled to identify all work which will not hold until the next scheduled patrol and maintenance event. As we are currently discussing pruning, the patrol would identify all trees along the circuit that would breach the limit of approach prior to the next scheduled maintenance event. If you are wondering why I would choose the limit of approach, given what we know about how trees cause outages (Bill Rees’s group at BG&E, John Goodfellow) it’s because beyond that point the work becomes increasingly more expensive (Browning and Wiant).
The graphs I’m providing show data from a distribution system. Unless otherwise stated my comments are in the context of a distribution system and I will use contact with a conductor as the limit of approach.
Let’s look at that frequency distribution and for the time being we’ll consider just one circuit. Year 0 on the graph represents the last pruning event. Do you see an implicit pruning maintenance cycle on this graph? Well in year 6 after the last pruning event you can expect over 95% of the sites to be hot. Many of these sites will have branches growing between the conductors. That is a major safety challenge and consequently is costly. Additionally, at how many locations will you have had branches bridging phases and causing a fault? What are the implications if you experience some high winds?
Let’s consider a 4-year pruning cycle. In Year 4 more than a ¼ of the sites will be hot. You can expect as many as 8.64% of the sites will have branches growing between phases. You also need to prune all the sites that will not hold until year 8. On a 4-year cycle you essentially prune every site every four years. You have to assess what the reliability implications are of having 26.77% of the sites with trees breaching the limit of approach.
We can also consider a three-year pruning cycle. In year 3, 8.64% of the sites would be breaching the limit of approach. That means most of the pruning could be efficiently done because at most 2.07% would be growing between phases.
The choice is between a 4-year and a 3-year cycle. The 4-year cycle is likely less expensive but you need to be willing to accept the associated reliability. You could reduce the cost of the 3-year cycle by leaving the about 21% of the sites coming due in year 6 and consequently have 5 years of superior reliability and 1 year in 6 where reliability will be about equal to that resulting from a 4-year cycle.
Personally, I would choose the 3-year cycle. If we now consider the whole system rather than just one circuit, the worst case is the one year in 6 when you would 20.86%/3 of the system breaching the limit of approach. This would position an urban utility to minimize tree-related interruptions. For a system with a large rural component, the vast majority of tree-caused outages would arise from some sort of tree failure. The shorter 3-year inspection cycle will help considerably in addressing the major source of tree-related outages by providing a more effective identification of hazard trees. We’ll examine tree failures in subsequent articles.

