Permitting Process
Avangrid Inc., a member of the Iberdrola Group, partnered with CHA Consulting Inc. to improve how its utilities navigate the environmental permitting process. The goal was to create a unified desktop application to improve the environmental review process by increasing documentation completion efficiency, so environmental impacts could be identified early in the design process — saving time and money.
CHA used Esri’s ArcGIS Online (AGOL), a cloud-based mapping and analysis program, with ArcGIS desktop to create an interactive system that layers environmental geographic information system (GIS) data over circuit-scoping areas that define a project’s work. The web tool was designed to improve what was a slow, manual process to allow for different user roles, including viewers and editors, that all Avangrid's contractors could operate.
The previous process was tedious, requiring the environmental department at Avangrid to reach out to internal distribution construction managers to obtain available scoping documents for a proposed circuit. Depending on the location of the circuit, these documents could be obtained from one of several different construction managers. Once the scoping documentation was secured, the environmental department would need to visit multiple websites to review any potential environmental impacts on the project.
With the potential for multiple types of users, from office personnel to construction personnel, it was imperative the solution be easy to use and enable collaboration between multiple users at different locations. Additionally, with AGOL, data could be secured with sharing permissions. Sharing data with password-restricted users would enable Avangrid's data to stay protected from the open public. Then users could access the data through a web browser in the office or on a tablet in the field, bringing the process to users' fingertips while conducting field surveys.
Data Layering
Avangrid provided circuit data in shapefiles format, including circuit conductors, structures, devices, transformers and outage interruptions. Then it was determined what information was freely available to layer into the mapping from New York state (NYS) databases. Most data was available through the NYS GIS Clearinghouse website as a downloadable shapefile, geodatabase or web mapping service (WMS), which collects georeferenced map images over the internet. A map server typically produces these images from data provided by a GIS database.
- Stormwater mapping
- Wetland mapping
- Environmental resources mapping
- NYS cultural resource information system (historical and archeological information).
When determining the type of data needed, it was important to remember each state differed in what was publicly available. Much of the information would be county specific and either freely available or available for a small fee, which would need to be considered. For this project, a collection of geodatabases and WMS were used to create a web map to drive the web application, which was then released to Avangrid's environmental team.
Web Application
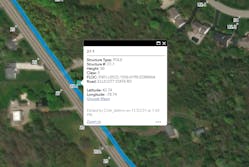
Once the environmental-specific information was collected, layers in the web map — such as symbology, pop-ups, visibility ranges and more — were created and customized based on discussions with Avangrid, with the intent to create a user-friendly interface. Hyperlinks were added as a feature, specifically a link to launch Google Maps at pole structures. This gave viewers access to the street view, if available, to assess work locations visually.
After the map was established, it was used to create the web application with more custom functionality, such as the ability to search, filter and measure. Scoping documents for each of the specified Avangrid projects were provided to CHA, and a process was developed to create work zones or mitigation zones for each circuit and program at pole locations based on the type of project and work being performed.
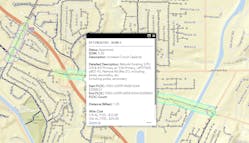
Using ArcGIS desktop and the geoprocessing buffer tool, a geodatabase feature class was created for the scoping zones. The buffer tool placed a 200-ft (61-m) buffer around each pole location. This buffer gave Avangrid a bubbled look that they were already accustomed to with the original scoping maps. Each feature class created was customized to enhance the planning and review process. The geodatabase includes domain values for some of these attributes. These domain values allowed for drop-down lists to help with data collection and editing continuity.
Environmental Data Review
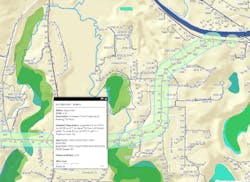
To start an environmental review, the Avangrid user goes into the web application and uses filters to select a particular circuit and base map, such as a street map, topographic map or even an aerial-image base map. They can then on layers containing poles, conductors and devices imported from Avangrid's GIS system, which contains asset information. From there, a filtering system was added to review whatever circuit was required at that time. After filtering to the desired circuit, scoping layers can be turned on and environmental layers overlain to show where environmental concerns — such as wetlands, remediation sites and petroleum bulk storage sites — overlap with a proposed project.
The reviewer can reach out for additional detailed information once a full field survey is completed to determine whether changes need to be made to a design to avoid requiring a permit or to limit environmental impacts. For example, if a pole was being replaced in a wetland because of equipment replacement, but the pole was in good condition, a decision could be made not to replace the pole. If a wiring upgrade was being performed and the path was through an archaeologically sensitive area, a different pathway could be chosen to avoid that area; this would eliminate a potentially time-consuming and costly environmental review.
Program Gains
Many advantages were recognized as part of this program:
- With any cloud-based service, the more data stored, the more expensive the hosting fee. It was advantageous to use a WMS when available rather than upload individual shapefiles or geodatabases to save on storage costs. Avangrid can view and use the mapping system without wasting valuable storage space on its AGOL account.
- A WMS is maintained by the host server. As data is updated in the WMS, in this case by NYS, it also is updated in the maps when refreshed. This approach helps to save on maintenance costs because data does not have to download and reload in the mapping system regularly — only at established intervals for maintenance to ensure the data is accurate.
- Enabling users to see the proposed scope of a project layered with environmental data accelerates the process, so a review can be completed earlier in the project. This allows for discussions on adaptations to the scope, saving the utility time and money.
- Some counties' rights-of-way (ROW) can be layered into the web map, enabling the ROW department to find parcel numbers and addresses to assist with the process.
An additional and unexpected benefit was the ability to layer parcel and tax map data directly into the tool, thereby facilitating a quick project overview for the management of our ROW and easements. This enhanced collaboration between our environmental, compliance, engineering and projects departments. The environmental web tool is now an integral part of the distribution project team's process to deliver distribution projects in an accurate and timely manner.
Meeting Deadlines
With environmental permitting becoming increasingly important to ensure regulations and construction timelines are met, it is critical to be aware of potential impacts early in the life span of a project. Using Esri’s AGOL with ArcGIS desktop, a collaborative system was designed. It provides an interactive, user-friendly way for a variety of users — including viewers and editors — to investigate potential environmental impacts.
Avangrid's environmental and ROW permitting departments can review a project's scope while also identifying and analyzing the proximity to pertinent environmental data. The new process using the GIS web tool has allowed time to seek permits or determine other potential solutions to make necessary project revisions in environmentally sensitive areas. The user-friendly tool has significantly improved Avangrid’s environmental review process, ensuring contractors and construction schedules are aligned to meet deadlines.
Lynda Milford ([email protected]), P.E., is a project team leader for electrical distribution at CHA Consulting Inc. She has over 20 years of experience working in utilities on feeder hardening and environmental and geotechnical engineering. She performs technical and managerial roles for overhead distribution resiliency programs, circuit scoping, workflow and quality assurance/quality control review.
Andy Gumkowski ([email protected]) is manager of distribution projects at Avangrid Inc. He has over 15 years of experience in electric utilities. In addition to working in substation and distribution engineering, he has led operations in substation, distribution and transmission lines. Gumkowski currently manages a profile of distribution projects in New York and Connecticut, focusing on system resiliency, hardening, and automation. He leads a robust team focused on engineering and construction, from project inception and commissioning to closeout.
For More Information
CHA Consulting Inc | www.chacompanies.com


