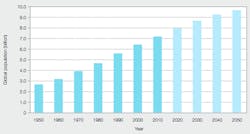
1 Growth of global population between 1950 and 2050 according to United Nations, Population Division, 2011 [1]
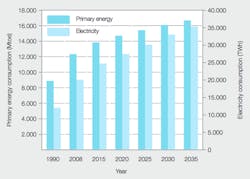
One of the most dramatic changes seen on planet Earth in the past few decades is the explosive growth of the human population. From 1950 to 2010 the population increased by a factor of 2.7 and by the end of 2011 there were more than seven billion humans living on the planet ➔ 1. Population growth is expected to continue for several decades yet and flatten out only beyond 2050, by which time total population will have increased by 35 percent, from today's figure, to 9.2 billion people. There has been a corresponding growth in the demand for power ➔ 2.
2 Growth of global primary energy and electricity demand (IEA New Policies Scenario) [2]
Growing energy and electricity demand
Aside from pure population growth, energy demand is also boosted by the rise of developing economies: a one percent increase in gross domestic product (GDP) increases energy demand, on average, by 0.6 percent. The overall costs of energy are around seven or eight percent of global GDP and constitute therefore, a substantial cost factor. This makes it very important to have highly efficient energy production and transportation processes. Further, when calculating energy costs, it is important to evaluate them over the total life cycle and include the costs of energy losses during the utilization phase as well as the initial equipment costs.
Of total global energy consumption, only 15 percent is actually consumed as electrical energy, though 38 percent of primary energy is used to create that portion. Since electricity is a high-quality form of energy, it can be used for any kind of application. Additionally, it does not leave any pollution or emissions at the place of use. This ensures demand will continue to increase and that electricity will continue to take an ever larger share of the market. Prominent examples are the replacement of oil or gas central heating systems by electric heat pumps or the introduction of electric vehicles.
Although overall efficiency is increasing, thus reducing primary energy needs, demand for electrical energy itself continues to increase. Whereas in developed countries the average electricity consumption is about 1.0 kW/person, the global average is only 0.3 kW/person. This is an indicator that further strong growth will occur in developing countries, driving a demand for high-efficiency transmission and distribution equipment.
One significant factor driving an overall increase in electricity demand is the energy appetite of information systems and telecommunication infrastructure. Modern, large data centers, for example, belong to the largest users of electricity.
Urbanization
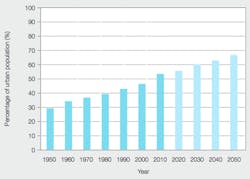
Another prominent trend is urbanization. More and more people are migrating from rural areas to cities. By 2050, two thirds of the world's population will live in cities, up from half now ➔ 3.
3 Percentage of urban population [1]
In 1950 the agglomeration of New York- Newark was the world's largest, with a population of 12.3 million. Today it is Tokyo, with a population of 37.2 million, followed by Delhi (22.6 million), Mexico City, New York-Newark and Shanghai (each slightly over 20 million). According to the United Nations Population Division, there are now 24 cities with a population of 10 million or more. Supplying these megacities with food, goods and utilities is a major logistical challenge. This also applies to the supply of electricity. The power density in areas tightly packed with skyscrapers is very high and new solutions are required to bring electric power into the city centers in a safe and reliable way. Real estate can be too expensive and hard to come by to use for substations, so these often have to be situated underground.
Climate change
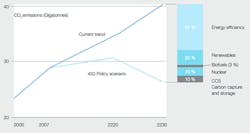
One of the most significant challenges facing the planet lies in the effects of greenhouse gases and climate change. While there are several gases that contribute to the greenhouse effect, carbon dioxide (CO2) is the principle concern. If a significant warming of the earth's surface in the next 20 years is to be avoided, then major policy changes will be required to stop irreversible climate change. In 2010, global energy-related emissions of CO2 jumped by 5.3 percent to a record 30.4 Gt (Giga tons). On current trends it is estimated that CO2 emissions will exceed 40 Gt before 2030, causing a global temperature increase of 3.5 C. However, under the 450 policy scenario1, global energy related emissions are expected to peak before 2020 and then decline to 21.5 Gt by 2035.
Footnote
1 The globally-agreed goal under the United Nations Framework Convention on Climate Change that would require the long term atmospheric concentration of CO2 to not exceed 450 parts per million. Achieving the 450 policy will require a different energy mix in the future. The two main drivers for this are energy-efficiency improvements and significantly increased renewable energy usage ➔ 4.
4 World energy-related savings by policy measure under the 450 policy scenario, relative to reference scenario
Energy efficiencies in power networks can contribute to CO2 reduction. Distribution networks are usually better than 95 percent efficient and distribution transformers better than 99 percent efficient. Despite this, the sheer size of the distribution transformer installed base means the aggregate loss accounts for a significant portion of the losses in the distribution network. So, even small improvements in transformer efficiency can significantly reduce CO2 emissions in absolute terms.
Transformer efficiency is considered either from the loss value point of view, or it is given as an efficiency value.
Efficiency values are compared at 50 percent load. National standards governing losses for transformers have been undergoing significant changes in recent times as government and utility regulators seek to live up to their commitments and responsibilities with respect to energy efficiency and climate change.
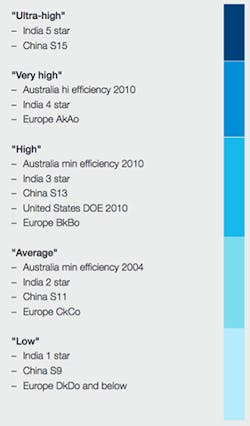
5 Efficiency classes of distribution transformers in different countries
Efficiency categories differ between countries ➔ 5. The low and average categories of efficiency are being phased out and all countries are moving towards high, very high or ultra-high classifications. Ultra-high efficiency is reserved for transformers with amorphous core metal (see articles on the Green-R-Trafo and the EcoDry transformer in this publication).
The second key element for future avoidance of CO2 emissions is the generation of electricity from wind, solar, wave or geothermal sources. In 2011, renewable power (excluding large hydro) accounted for 44 percent of the new generation capacity added worldwide. 2011 saw global investment in renewable power and fuels increase by 17 percent to a new record of $257 billion. This is a six-fold increase on the 2004 figure [3]. According to the International Energy Agency's (IEA) world energy outlook, it is expected that the percentage of renewable energy satisfying primary energy demand will rise significantly to about 8 percent by the year 2030.
The key drivers for this growth are government incentivization and falling technology costs. In 2011, the prices for photo- voltaic modules fell by 50 percent, while the price for wind turbines decreased by 10 percent. This closes the price gap between renewable and fossil fuel sources. If this trend continues, then, according to the IEA, grid parity can be achieved in the solar market by 2020 or before, allowing for this technology to compete in the open market place against traditional fossil fuel technologies.
Life cycle costs
In order to support decisions on investments, a return on investment (RoI) calculation is normally performed. This should consider not only the cost of a specific element, but also the costs arising during its use. The life cycle costs contain, therefore, the initial purchase costs of the component or system; the related additional installation costs; the costs of operation, which can be the costs of energy losses; the costs for maintenance; and the disposal costs at the end of the investment's life. Although transformers have a high efficiency, typically above 99 percent, energy losses add up to a high financial value, which often significantly exceeds the initial costs. Utilities are increasingly using a special method called total owning cost (TOC) to evaluate transformer investments. TOC assigns a financial value to the specific no-load and load loss values of a transformer. These mainly depend on the utility's energy costs and investment conditions. This issue contains a separate paper on TOC.
Smart grid
One of the main challenges of integrating distributed variable generation is the effect on power quality, specifically the voltage bandwidth spanning the multifaceted local generators and the network load requirements. In the past, power generation was centralized with unidirectional power flow and the main consideration was just the voltage drop. However, now, and increasingly in the future with increased penetration of distributed variable generation, the power flow will become more complex, leading to voltage drops and rises. This presents the challenge of regulating voltage over a much larger bandwidth. Voltage regulation, traditionally used in high-voltage and medium-voltage transformers, will now be required in the medium-voltage and low-voltage network to provide local regulation.
Asset monitoring
Another future trend will be asset monitoring of distribution transformers in the network. This will allow operators to develop a more reliable distribution network and identify problems before a failure occurs. The fault type and location will be quickly identified and customer outage time minimized.
Traditionally, the transformer in the distribution network was a passive piece of equipment, but in the future it will become an active component of the network that dynamically interacts to ensure capacity, reliability and efficiency in the network.
Future perspective
Population growth and increasing energy usage are causing global CO2 emissions to rise, with consequent undesirable effects on climate. In mitigation, a move towards more energy-efficient components in the power network, along with effective integration of lowcarbon technologies, will be essential. ABB recognizes these future network requirements and has developed a product portfolio of distribution transformers to meet the challenges of the future.
Martin Carlen
ABB Power Products
Zürich, Switzerland
[email protected]
Patrick Rohan
ABB Power Products
Waterford Ireland
[email protected]
--------------------------
References
[1] United Nations Department of Economic and Social Affairs, Population Division: Population Estimates and Projections Section. World Urbanization Prospects, the 2011 Revision: Data on Urban and Rural Populations. Retrieved 31st July 2012 from http://esa.un.org/unpd/wup/CD-ROM/Urban-Rural-Population.htm
[2] International Energy Agency. World Energy Outlook 2010 Edition. Retrieved 31st July 2012 from http://www.worldenergyoutlook.org/publications/weo-2010/
[3] United Nations Environment Programme. Global Renewable Energy Investment Powers to Record $257 Billion. Retrieved 31st July 2012 from http://www.unep.org/newscentre/Default.aspx?DocumentID=2688&ArticleID=9163

