The PEL 100 series from AEMC Instruments is a low cost, simple to use, one, two (split phase) and three phase (Y, ∆) power and energy data logger. There are two models available; Model PEL 102 (no display) and Model PEL 103 (with a backlit digital display).

This product is ideal for electricians, engineers and contractors doing work in the area of building and system monitoring and upgrades, as well as residential and overall energy audits. All vital energy data is easily measured, recorded, and analyzed. Reports can be generated with confidence with minimal configuration time and effort (Standard and Customizable Reports supplied).
The PEL 100 series has many up-to-date features demanded by the present market conditions for energy and power consumption information needs.
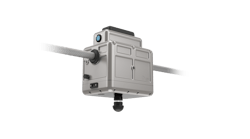
The instrument’s design enables it to be installed inside a load center panel (including the current sensors) and still allow the door to close on most panels. The PEL 100 series offers all the essential functions for logging power/energy data from most electrical power networks in use today across the world (17 network set-ups provided). The PEL 100 series power and energy loggers measure and record three voltage inputs and current inputs, Watts, VARS, VA and Energy (kWh and kVA). Power Factor (PF), Displacement Power Factor (DPF), Crest Factor, Frequency and THD are calculated and recorded as well. Individual harmonic % information from 1 to the 50th harmonic are recorded at the operator’s choice. All variables are recorded and stored at a one second interval and on user selectable demand intervals from 1 to 60 minutes.
Energy costs can be calculated and displayed quickly and easily by simply inputting the unit cost for a kilowatt hour into the software. Data is stored on a removable SD card. Data can be retrieved using a USB, Bluetooth and/or Ethernet (local or internet) connection by transporting the SD card back to a PC. The comprehensive DataView software (included) provides the ability to view data from several hundred PEL 100 series instruments on a local network or over the internet allowing the user to evaluate energy usage in a department or facility basis, a remote site, or even in a city, anywhere in the world. DataView® allows measurements to be viewed in real-time on a PC and stored data to be downloaded for analysis and report generation.
Configuration of the PEL 100 series instruments is accomplished through DataView software either locally or remotely. Most of the configured parameters are pre-set in the instrument, keeping the user interface very simple and straightforward. Current probes are automatically detected and scaled to a pre-defined or user specified configuration when connected to the instrument. User selections include network type, demand interval, recording length, voltage and current ratios (where necessary), recording duration (defined either by time and/or date) and communication method. Password protection can be configured for Bluetooth and network communication to guard against unauthorized access and protection of data integrity.
The DataView software provides the ability to view power, harmonic (for AC measurements) and RMS as well as DC data in real time and download recorded sessions for more extensive analysis and report generation. One second trend data, demand interval trend graphs and tabular listings can be displayed and printed. Energy costs can be calculated from the downloaded session. Source and load graphs can be plotted. Individual phase and the sum of all phases can be evaluated. Once data is downloaded and displayed, the user has access to a variety of tools to analyze individual data points or sections of the recorded data without the frustration of having to deal with layers of button pushing to get to the information they need.
This simple to use yet comprehensive power and energy logger will be an invaluable asset to your power and energy monitoring and analysis needs.
Features:
- Measurement of RMS voltages and currents at 128 times per cycle and stored every second
- Measurement of VA, W and var power values (total and per phase) stored every second
- Measurement of VAh, Wh and varh energy values (total and per phase) per second with source/load indication
- Calculation of the cos φ Displacement Power Factor (DPF) and the Power Factor (PF) stored every second
- Calculation of Total Harmonic Distortion (THD)
- Measurement, calculation and display of the harmonics up to the 50th order for 50/60 Hz and 7th order for 400Hz
- Measurement of the DC quantities (RMS calculation)
- Display Measurements (PEL 103)
- Electrical network quantities are stored on a removable SD-Card
- Automatic recognition of the connected current sensors
- DataView software for data storage, real-time display, analysis and report generation with supplied pre-defined or custom templates
- Minimual programming required
- Compact and rugged case
- Versatile communication interface choices built in (USB, Ethernet, Bluetooth)