Utilities are being challenged worldwide by a common problem: they need more transmission and distribution capacity and they need it now. The demand for power continues to grow at unprecedented levels, which requires more wire in the air to deliver it. In addition, renewable-generation power producers are coming on-line, needing huge amounts of capacity to get their electricity to market, and transmission providers are under mandates to provide them with connections to the grid, thus the need for more wire.
Unfortunately, it is just not that easy to add transmission or distribution lines to the grid. The process can take a decade to complete, not to mention the expense. That’s not to say utilities have not been increasing their line inventory, they have been, which points out how important it is to get the maximum power transfer from what they have.
It is estimated that there are more than 200,000 miles (321,869 km) of high-voltage (230 kV and above) transmission lines and roughly 5.5 million miles (8.85 million km) of distribution lines in the United States alone. Globally, grids are growing, too. It is estimated China will have more than 560,000 miles (901,233 km) of high-voltage transmission by 2015. In June 2013, the World Nuclear Association noted the European Union will have to spend about US$128 billion for new and upgraded power lines to meet capacities required by pending renewable generation.
However, there is another method to cope with this challenge and that is the deployment of sensor and monitoring technologies across the grid. Advancements in sensor technologies now allow sensors to be placed directly on transmission and distribution lines. Although these devices have been available for many years, it has only been recently that technological advancements have reduced their prices to the point they can be deployed in sufficient numbers to monitor an entire line.
The numbers are large enough to give researchers the ability to tell exactly what is going on for the entire length of the line (sufficient data to develop real-time dynamic models of the lines to upgrade loading limits on those lines).
Static vs. Dynamic
Researchers have long recognized there is a huge untapped capacity sitting out there waiting for the electric utility industry to move from the old-school static line ratings (SLRs) to dynamic line ratings (DLRs). Without being able to monitor real-world conditions in real time, a utility’s engineers were unable to take advantage of the full ability of the conductor. Without getting into a long-winded discussion of engineering criteria for transmission design, the thermal rating of the conductor is only one aspect of limiting power flows. There also are concerns with system stability, questions of excessive voltage drop and the line’s surge impedance loading to deal with, but thermal ratings of the line is the low-hanging fruit staring the industry in the face.
Look at the Drake conductor used on a great deal of transmission lines around the world. One utility in North America assigns the thermal rating of 100°C (212°F) and assumes there will be a perpendicular wind speed of 2 ft/sec (0.6 m/sec) continuously, which gives them a rating of 990 A for the line. That 2 ft/sec (0.6 m/sec) assumption is fairly common with most reference charts found in the industry.
The utility in this example has been looking into increasing the wind speed to 3 ft/sec (0.9 m/sec), which increases the rating to 1,080 A, a 9% increase, according to the utility’s calculations. If the utility increases the wind speed to 4 ft/sec (1.2 m/sec), it causes the rating to jump to 1,160 A, a 17% increase. But, how does the utility justify moving to higher wind speeds for the rating increase?
Wired Structures
That is why a DLR system in real time is gaining so much traction with utilities, regulators and independent power producers. If utility A rates a transmission line 10% or 20% higher than utility B, and the lines appear to be identical to the observer, there is going to be a lot of attention given to the utility with the most conservative assumptions.
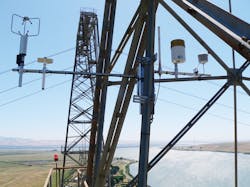
Unfortunately, it’s not that simple. The environment is dynamic as is the grid, which implies the rating system for the lines has to be dynamic, too. As with all things, timing is everything and no more so than adapting smart grid technology to every component of the grid. The emphasis is having sensors embedded on the towers, in the hardware and on the conductors. Fortunately, there is an ever-increasing variety of sensors available. They can record everything from the temperature of the conductors, to monitoring weather conditions, to measuring the current flowing through the conductors.
Variety of Sensors
The Electric Power Research Institute (EPRI) has been developing some remarkable new sensors that can be applied to the conductor and the structures themselves. For lines, they have sensors to monitor conductor splices, leakage current and lightning strikes. For structures, there are sensors to detect vibration, animal interactions, vandalism and corrosion. All of these sensors talk with monitoring systems, which convert the poles into a series of information hubs with data from all of these various systems.
ABB has developed the line thermal monitoring system to monitor and display actual situational data regarding the thermal stability of a transmission line. It uses sensors and phasor measurements taken by two phasor measurement units located at each end of the line. The system gives new perspectives to the dynamic interaction of transmission lines to the network and how they impact power flow.
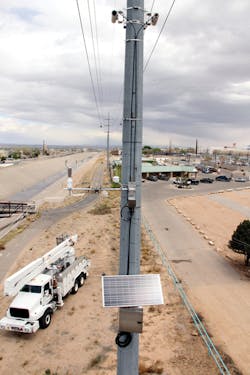
EDM recently introduced an interesting system it calls Span Sentry. It combines the company’s Sagometer — a smart camera with a target and a data logger — with some line-mounted current sensors, weather stations and communications equipment to monitor the line for sag and conductor temperature.
Three beta-test versions of the Span Sentry system have been installed on transmission lines belonging to Public Service Company of New Mexico (PNM) and Pacific Gas and Electric (PG&E). PNM has expressed interest in the system’s ability to automate the ampacity calculations associated with planned outages and emergency contingencies. PG&E has installed these systems in an effort to maintain load while ensuring minimum clearances are not violated. This allows PG&E to defer expensive line upgrades for two years.
Southwire has an agreement with EPRI to commercialize an EPRI conductor sensor that measures conductor temperature, inclination and conductor motion along with weather data. This data is then communicated to the utility’s energy management system to give them the real-time status of a line.
Siemens Energy Inc. provides the ISCM Overhead Line Monitoring system. It uses temperature sensors, load cells, cellular or radio communications, and advanced rating algorithms to maximize the capabilities of a utility’s lines with minimum operator adjustments.
Pike Electric’s smart device is called the ThermalRate system, which models the transmission lines from monitors placed along the transmission line corridor using a replica of the line conductor oriented in the same direction as the line. Its computer uses the IEEE Standard 738 equations to model what is taking place in the actual transmission line compared with the replica.
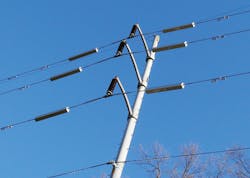
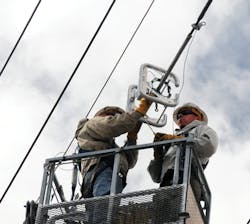
The USi’s Power Donut2 is a completely self-contained sensor that can be installed using a hot stick with no required outage. The device measures current, voltage, conductor temperature and conductor inclination (angle from horizontal).
Promethean Devices makes the non-contact Real-Time Transmission Line Monitoring System (RT-TLMS), which captures phase currents, measures conductor clearance/sag, computes conductor temperature and delivers a line rating based on the actual thermal capacity of the line. The ground-based system is installed within existing rights-of-way and does not require line crews or specialized equipment for installation.
The CAT-1 tension monitoring system from Valley Group monitors the mechanical tension of both ruling span sections at a dead-end structure of a transmission line. Sags can be measured and electrical clearances can be calculated from measurements made by the CAT-1 sensors.
Lindsey Manufacturing introduced a rather unique device at the 2012 IEEE Power and Energy Society T&D Expo: the Transmission Line Monitor (TLM). Developed in conjunction with the Idaho National Laboratory, the TLM uses light detection and ranging (LiDAR) technology for height measurement of the transmission line. Its onboard sensor package incorporates two temperature sensors: one measures conductor temperature up to 250°C (482°F) in real time and the other measures ambient temperature. A pair of dual-axis microelectromagnetic system accelerometers measures the vibration characteristics of the transmission line and determines its tilt and roll. It communicates through a wireless network.
Ampacimon Overhead Line Monitoring and Alstom have partnered to provide the industry a complete monitoring package using direct line-mounted sensors. The Ampacimon unit uses autonomous vibration monitors to capture sag data directly out of the vibration frequency spectrum. The device communicates through global system for mobile communications (GSM)-general packet radio service (GPRS) electronics to Alstom’s sophisticated monitoring package to calculate real-time line ratings.
Opten Group of Moscow, Russia, provides an on-line transmission line monitoring system using sensors that directly measure conductor temperature and current. The data is transmitted to the utility using cell phone technology, where it is combined with conductor position data to predict conductor behavior in relation to adjacent objects and terrain, giving the utility real-time dynamic ratings for the transmission lines. Konstantin Mekhanoshin, Opten’s business development officer, reports that just less than 100 systems have been installed on Russia’s Interregional Distribution Grid Co. network, with more coming.
GridSense offers the Line IQ device, which is a fault detection monitor used to detect faults quickly for correction and restoration before they can cause major disruptions. The device can be installed directly on the conductor in minutes using a hot stick to avoid outages.
Dr. Deepak Divan, president of Varentec, offers a solution that provides a measure of local control over the distribution system. In essence, Varentec provides a single-phase, box-mounted device weighing 35 lb (16 kg) that is placed on the low-voltage side at selected locations on the distribution system. Each device can be adjusted to deliver up to 10 kVAR. Three devices can be installed on a single site to address three-phase circuits.
By placing a series of these devices at select locations, local stability and load-flow issues can be addressed. This technology enables distribution utilities to address issues including peak demand reduction and power factor control, while also providing tools to address the impact of broad-scale customer solutions including large-scale solar and demand-response rollouts.
Theory Meets the Real World
With all of this new technology available, the U.S. Department of Energy (DOE) has funded some research projects on utility systems to determine whether applying DLR equipment will actually result in better management of the grid. One of these projects, the DOE–Oncor smart grid demonstration project, took place on the Oncor transmission system, which was recently completed.
Oncor installed 42 load-cell tension monitors feeding into supervisory control and data acquisition located in substations distributed along transmission lines in central and west Texas, U.S. These lines had been identified as significantly constrained by the Electric Reliability Council of Texas (ERCOT).
It was an extremely large-scale evaluation of real-time line monitoring equipment on energized transmission lines in ERCOT. At each location, sensors were attached to transmission towers. Radio receivers were installed inside 10 substations. The remaining DLR components were housed at a transmission management system control center in Dallas.
Oncor purchased the DLR equipment and managed the project. Major participants in the project with Oncor were The Valley Group, a Nexans company, Siemens Energy Inc., EDM International, Promethean Devices, Chapman Construction Co. and Southwest Research Institute.
Oncor installed The Valley Group’s tension monitoring CAT-1 devices, EDM’s Sagometer systems and Promethean’s RT-TLMS apparatus on their lines. Oncor was able to accurately monitor the sag/clearance of the instrumented lines. It found the DLR provided capacity above the static rating and the ambient adjusted rating more than 90% of the time. Oncor also noted the DLR technology had the potential to impact congestion positively on the system.
Another research project partially funded by the DOE was the Evaluation of Instrumentation and Dynamic Thermal Ratings for Overhead Lines project. The New York Power Authority (NYPA), New York Independent System Operator and EPRI all worked on the project. EPRI’s Dynamic Thermal Circuit Rating software was used to monitor the thermal state of selected transmission lines. The goal was to directly correlate the benefits of real-time dynamic ratings in areas where the potential for wind generation was high.
NYPA installed EDM’s Sagometer along with a Campbell Scientific weather station, Pike Electric’s ThermalRate system and a host of new EPRI sensors under development. The sensors were installed in late 2010, and data collection started immediately after the installation.
Using the IEEE 738 weather model, NYPA determined the line ratings and found, after several years of data gathering, that the static ratings were more conservative than those determined by data from the sensors. The dynamic rating was higher than the static rating the majority of the time, more than 90%. NYPA also noted that the periods when the dynamic ratings were lower than the static ratings were relatively brief and infrequent.
The Tennessee Valley Authority (TVA), the DOE and Smart Wire Grid Inc. deployed an array of 99 SWG distributed series reactance units on one of TVA’s 161-kV transmission lines. The units provide sensing and monitoring of the line and, when needed, can inject inductive reactance to improve power flow (see T&D World April 2013 for more details).
A Different Grid
The industry now has the ability to determine a transmission or distribution line’s rating in real time by remotely monitoring certain mechanical and thermal characteristics of the line. Thanks to advancements in sensor technology and the maturing of smart grid applications, the benefits of dynamic overhead line ratings are being experienced throughout the industry. They are allowing utilities to reduce or defer capital expenditures, improve congestion and push more power to the customer.
Initial real-time monitoring results show dynamic rating improvements ranging anywhere from 5% to 20% over static line ratings. This is a huge improvement for the transmission-constrained grid, especially considering this capacity can be added without any public hearings, regulatory approval or system outages.
About the Author
Gene Wolf
Technical Editor
Gene Wolf has been designing and building substations and other high technology facilities for over 32 years. He received his BSEE from Wichita State University. He received his MSEE from New Mexico State University. He is a registered professional engineer in the states of California and New Mexico. He started his career as a substation engineer for Kansas Gas and Electric, retired as the Principal Engineer of Stations for Public Service Company of New Mexico recently, and founded Lone Wolf Engineering, LLC an engineering consulting company.
Gene is widely recognized as a technical leader in the electric power industry. Gene is a fellow of the IEEE. He is the former Chairman of the IEEE PES T&D Committee. He has held the position of the Chairman of the HVDC & FACTS Subcommittee and membership in many T&D working groups. Gene is also active in renewable energy. He sponsored the formation of the “Integration of Renewable Energy into the Transmission & Distribution Grids” subcommittee and the “Intelligent Grid Transmission and Distribution” subcommittee within the Transmission and Distribution committee.
