Back in the late 1960’s and 1970’s coal was truly king in the U.S power market. During the 15-year period from 1968 to 1982, nearly 200 GW of new coal capacity was brought online – accounting for 43% of all capacity additions. Today natural gas power dominates the power generation landscape, and given the attractive capital cost advantage, relatively low fuel prices and the fact gas power can be turned on and off within minutes if not seconds, natural gas is the fuel of choice moving forward.
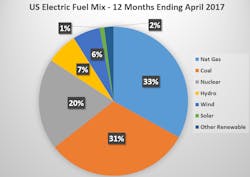
The Energy Information Administration’s (EIA) most recent Electric Power Monthly report highlights the current and future market for natural gas. Considering the most recent 12 months of reporting ending in April 2017, natural gas accounted for 34% of the overall fuel mix – slightly ahead of coal at 33%. Though both wind and utility scale solar capacity has increased significantly in recent years, in terms of electric output the two leading renewable fuels accounted for only 6.9%. Natural gas, coal and nuclear dominate power generation accounting for nearly 84% of the overall fuel mix in the U.S. Wind and solar, however, grew by a phenomenal 18.3% from the previous 12-month period ending in April of 2016.
Delivered Utility Natural Gas Prices Expected Higher this Summer
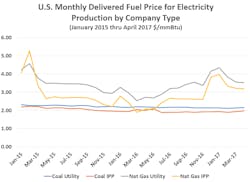
The delivered price of natural gas to regulated utility plants averaged $3.40/mmBtu during the 12-month period ending in April 2017 – up 6.9% from the previous year. The delivered price of gas to independent power producers was lower on average at $2.82/mmBtu – but still up 12.4% from the previous period.
The future is bright for gas given that Henry-Hub Futures continue to be attractive with January 2018 priced at $3.35 and January 2019 at $3.13.
Planned Capacity Additions Dominated by Gas
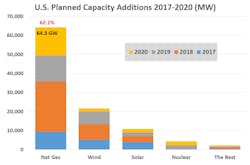
Over the next four years, planned capacity additions according to the recent EIA Power Monthly report are dominated by natural gas (64.3 GW), wind (21.7 GW) and utility scale solar (10.9 GW). The three sources account for 96.4% of all new capacity during the four-year period from 2017 through 2020.
Construction Costs Favor Gas
In a recent EIA Power Today article comparing construction cost of various technologies, natural gas showed a distinct advantage over both wind and solar. This further supports the reasoning behind why natural gas will continue to dominate the future of power generation. Considering the phasing out of tax incentives for wind and solar during the next several years the incentive for gas power is expected to rise.
Between 2013 and 2015, the capacity-weighted average construction cost for natural gas ranged between $700 and $1,500/kW installed. In comparison, wind ranged between $1,750 and $1,950/kW. Solar came in between $2,900 and $3,800/kW with the lowest average recorded in 2015.
One of Many Nat Gas Projects Making the News
AES Corporation reported earlier this month they had closed $2.0bn in non-recourse financing for their 1.4 GW Southland Repowering Project in southern California. The project will include 1,284 MW of combined cycle gas capacity and 100 MW of battery-based energy storage under a 20-year contract with Southern California Edison.
The project will replace 3.9 GW of AES existing gas-fired capacity with the more efficient Southland Project. The project will cost $2.3bn with approximately $350M in AES equity investment along with the approximate $2.0bn in financing.
The gas-fired capacity will be constructed by Kiewit Power Constructors Company under a fixed-price, date-certain EPC contract. Construction has already begun at AES’s Huntington Beach site and will be initiated this month at its Alamitos site. The gas power project is expected online in 2020 with the energy storage capacity expected online in 2021.
Nat Gas truly is King!


