Visibility Enables PV Integration
Hawaii continues to be a hotbed of solar activity with rooftop photovoltaic (PV) installation requests nearly doubling every year since 2012. As in California and Arizona, Hawaii utilities are contending with some of the highest distributed generation penetration levels in the U.S., with 17% of their customers having approved or installed PV systems. Renewable momentum and PV adoption are sure to continue as the state strives to meet one of the nation’s most aggressive renewable portfolio standard (RPS) goals: 100% renewable energy by 2045.
At the same time, the electric power industry is undergoing an unprecedented shift as a result of market, political and technological change. Nearly every facet of traditional grid operations is transforming because of increasing levels of renewable generation, especially from behind-the-meter customer generation. Utilities today are in a catch-22 with many business and technical practices based on conventional, centralized fossil generation that are giving way to more customer-sited, distributed resources based on dynamic transactive energy models. While these models lack a long-term track record, the data visibility they provide on performance impacts helps utilities to create new operational confidence and processes.
Faced with fast-paced change on all fronts, and the unique challenges of islanded systems without backup support of interties to other utilities, Hawaii utilities are working with innovative industry partners on pilots with grant support to bridge the knowledge gap. Efforts are underway to deploy new technologies and tools, and to integrate real-time forecasting, advanced decision-based analytics and visualization to better see and manage high levels of distributed weather-dependent renewables. The Hawaiian Electric Companies are demonstrating how collaboration can build practical solutions for proactive change and sustainable transformation toward the next generation of cleaner, more cost-effective renewable generation portfolios while minimizing risks to grid reliability.
State of the Grid
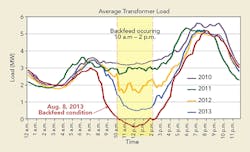
Because of high energy costs and incentives for solar installations in Hawaii, rapid adoption of customer-sited rooftop PV systems swelled rapidly, starting in 2012. With increasing numbers of rooftop PV systems, more circuits on the islands began to experience an excessive drop in the midday load. This resulted in backfeeding when the PV power generated locally exceeded the local need for power. Systemwide, the behind-the-meter solar generation is now as large as, or larger than, any single utility generator, but without the necessary visibility or controls. On Oahu, for example, aggregated behind-the-meter PV is more than 400 MW compared to the single largest utility controllable generator of only 200 MW. As a result, better visibility and the capability to forecast and manage variability impacts of aggregated distributed PV are high priorities.
The Hawaiian Electric Companies operate grids on the islands of Oahu, Hawaii, Maui, Molokai and Lanai. They are already contending with some of the highest levels of renewable generation from both utility-scale and distributed generating resources. Renewable generation of 40% to 50% of system electricity use on some days is among the highest in the nation. This is changing historical customer electrical use characteristics and management of the utility’s central plant dispatch, generation portfolio and reserve planning needs.
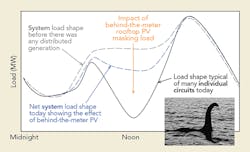
Hawaiian grids are exhibiting what has been coined the “Nessie curve,” which is similar to California’s “duck curve.” With the Nessie curve, the daytime load is being reduced by aggregated amounts of uncontrolled midday behind-the-meter PV generation, resulting in a steeper rise to the evening peak as the solar resources go off-line. This steep rise places additional operational burdens on conventional generators not designed to cycle or ramp at such frequency. This Nessie curve is impacting daily system operations on all the islands in Hawaii today. It poses concerns for all islanded grids, which must plan for all generation as well as reserves for operations and contingencies.
New Tools for Connecting
Seeing is believing. Transforming the electric power system requires new intelligent tools and technologies to manage diverse distributed resources and emerging dynamic transactive energy models.
Seeing is informing. Operating the future grid requires proactive analytics and heads-up predictive capabilities.
Seeing is enabling. Planning for the grid of the future requires innovation and collaboration with like-minded industry partners and engaged customers to increase awareness and adopt sustainable solutions.
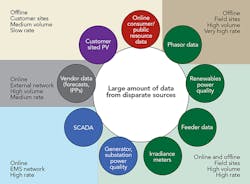
With increasing levels of distributed renewable generation, utilities are finding additional field-measured and distribution-level data are needed to inform future grid operations. Collecting, managing and evaluating such large volumes of data from diverse monitoring systems — including field devices, supervisory control and data acquisition (SCADA), and other behind-the-meter resources — require advanced analytical tools not readily available in most utility environments. Because of network firewalls, limitations on real-time data handling and analytics, utilities often are hindered from evaluating such data in a common framework environment. Yet this data is vital to understanding the operational impacts on the grid.
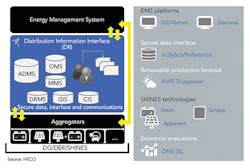
Over the last five years, Hawaiian Electric Companies have developed and operationalized a renewable database and decision analysis framework — called the REDatabase — comprised of an advanced time-series data management and common data analysis platform, and a flexible backbone architecture to support high-volume data exchange and integration of diverse data sets across a secure network. The REDatabase provides the backbone to support automation of real-time visualization, distribution model automation, real-time data translation and access, and robust information sharing to stakeholders and customers through online tools.
Hawaiian Electric Companies partnered with Referentia/In2lytics, a Hawaii-based information technology company, to develop a high-performance database and user interface for high-resolution time-series data analytics. Utility staff now can retrieve, assess and merge full-resolution SCADA and non-SCADA information at data-access speeds 200 times faster than previously available. They also can build customized tools to access high-resolution, high-volume data from field devices like synchrophasors and meters, and to interface with circuit and other customer information to troubleshoot or plan.
Utility operators and planners now can access and evaluate data quickly and easily from different data platforms (public and corporate-level secure SCADA networks) while preserving confidentiality and network security requirements. Dealing with distributed system management, the speed to access a diverse data pool is vital for real-time decision making based on information.
A fleet of remote monitoring sensors combined with new visualization tools and data-mining capabilities are providing perspective to help shape future grid capabilities and provide better customer options for managing energy use. There are three innovative visualization tools to “see and manage” solar:
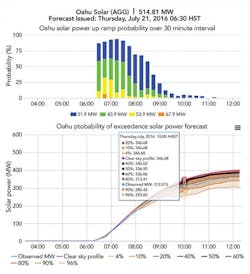
• The solar and wind integrated forecasting tool (SWIFT) provides a real-time look ahead (15 minutes up to six hours) of prevailing conditions in wind and solar for the Hawaiian Electric Companies service area. In collaboration with AWS Truepower, the SWIFT tool uses state-of-the-art numerical weather prediction and mesoscale models along with a utility-operated remote sensor network comprised of sonic detection and ranging (SoDAR), light detection and ranging (LiDAR), irradiance sensors and radiometer to provide forecasts and a bird’s-eye view of the wind contours and solar cloud conditions for the islands.
The solar forecasting feature is unique to SWIFT as it provides discrete forecasts for distributed resources with local and system views. While forecasting is not a silver bullet, by integrating the information into existing tools and familiar environments, such as the energy management system, Hawaiian Electric Companies are building operational confidence and trust in using forecasts to inform proactively and manage impacts of variable renewables cost-effectively.
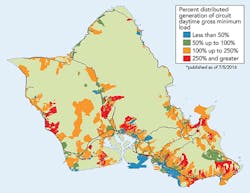
• The locational value map (LVM) provides visibility to high-penetration locations used to better inform customers and developers of areas likely to experience longer interconnection times, or that may require studies and upgrades for interconnection because of the existing installed PV levels. The LVM depicts, in a percentage, the installed megawatts of PV to the load of the circuit serving the area. Two views are provided, one based on daytime circuit load conditions and one based on maximum circuit peak.
• The Renewable Watch (REWatch) and REDatabase tools provide customers access and visibility to the system load as well as the amount of solar and wind generation contributing to the grid in real time. Prior to REWatch, there was no insight on accounting for aggregated distributed generation from behind-the-meter rooftop PV systems for planning or operations. As this information is not measured readily, rollout of the REWatch data and visual displays have enabled real-time accounting of distributed PV production from hundreds of thousands of distributed PV generators, without the added expense of metering and deploying additional dedicated PV monitoring devices.
These new tools have cost-effectively created visibility to what was not previously visible and are providing resource performance data to inform operations and planning, thus enabling more reliable adoption of solar resources.
Deployment Pilots
To meet the operating needs of the future, the Hawaiian Electric Companies are doing more than just wishing for solutions. To achieve the RPS energy goal of 100% renewables by 2045, the companies are actively pursuing and leveraging more than US$30 million in federal and state grants as well as industry funding to stimulate technology pilots and gain operational experience. This will enable development of new processes and operational procedures that account for renewables and distributed resources.
The grid of the future requires new models, data and communications capability. Utilities like those in Hawaii are faced with the challenges of high uptake of distributed rooftop PV. They are seeking to demonstrate a new set of cost-effective, intelligent and robust control solutions that can accommodate emergent technologies and modern infrastructure.
As distributed renewable resources continue to increase in Hawaii, additional opportunities to apply the renewable database are emerging. Efforts in development to help manage high-penetration issues have built successively on grant-funded efforts (DREAMS and SEAMS for SHINES) to include coordination of controls for distributed resource assets; secure API-enabled data exchange of forecast data and grid condition data with cloud-based environments; and risk-based continuous monitoring and proactive evaluation of change impacts on the grid.
Timely access to data will help to inform grid modernization needs. By design, the tools and platforms of the renewable database provide a flexible and scalable foundation to continue to support access, analysis and data-driven decision making for the future grid.
Active Engagement
Efforts to date have provided hands-on practical opportunities for utility staff, industry forecasters and energy management system (EMS) developers to engage and discuss their needs. By kicking the tires on forecasting and analytical tools and deploying field equipment, forecasters and utilities have a shared understanding of the level of detail and forecasting accuracy necessary to support real-time operations. Lessons learned from Hawaiian Electric Companies’ partnerships are resulting in more intuitive visualization tools, data sharing and EMS logic to help other utilities gain more sense of integrating renewables.
No single technology will be a silver bullet for the electric power industry. However, by seamlessly integrating more edge-of-grid devices and merging information into existing tools and familiar environments, such as the EMS, utilities are building operational confidence and trust to proactively inform and cost-effectively manage the impacts of variable renewables.
Dora Nakafuji is director of renewable energy planning at Hawaiian Electric Co. With more than 15 years of experience in renewable integration and energy research, she is leveraging $30 million of grant-funded efforts to enable real-time, short-term forecasting; advance visualization data analytics; and deploy smart technologies to modernize Hawaii’s grids. Nakafuji holds a Ph.D. in aeronautical and mechanical engineering from the University of California at Davis and a patent for advanced load control for wind turbines.
