As utilities transform their business models through the investment of advanced metering infrastructure (AMI), smart grid and similar technologies, the ability to collect, store and analyze detailed consumer and operational data becomes a critical competitive differentiator. South River Electric Membership Corp. (SREMC), located in Dunn, North Carolina, U.S., employs data analytics from AriesPro to achieve system loss reduction and energy efficiency. This is the first part of SREMC’s multiphase project to bring data-driven solutions to its business.
Data Analytics
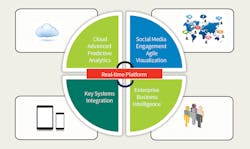
As a key systems integrator and data analytics company, specializing in smart grid, AMI, social media mobile solutions and unified cloud solutions for utilities, AriesPro integrates vital information stored in operational technologies (such as AMI) and builds near-real-time predictive analytics to make day-to-day informed decisions for engineering, operations and other departments at an enterprise level.
Excelling in the latest smart technologies, AriesPro is redefining data analytics for South River EMC to provide a wide range of benefits:
• Reduce energy theft/diversion by analyzing distribution systems
• Reduce transmission, substation and distribution losses by pinpointing where the greatest losses are in the electric system
• Reduce energy losses by identifying where and when equipment downtime and power failures can expectedly occur
• Improve asset utilization and reduce ancillary service cost by automating voltage and VAR control, real-time load measurement/management, and optimizing customer energy use
• Enhance unified outage analytics to promote operational efficiencies and improve reliability indices
• Predict consumer behavior and learn which customers are expected to respond to energy-conservation and demand-reduction incentives.
Loss Identification
At SREMC, phase I of this project included partnering with AriesPro to structure the data integration utility warehouse and develop reporting for distribution loss reduction, conservation voltage reduction (CVR) analysis, transformer load analysis and nontechnical loss evaluation. After the go-live date was achieved and data validation was completed, SREMC began the initial stages of analysis into distribution system losses.
The key to managing electric distribution system loss reduction efficiently is identifying where losses exist within the electric system. Using data from operational technology systems, losses can be pinpointed down through the feeder level to the transformer level. By incorporating energy costs, the costs of losses can be determined and used to evaluate the most efficient loss-reduction techniques for each part of the electric system.
Substation Level
In the figures, losses across the SREMC distribution system are identified by each substation over a defined time range in megawatt-hours, distribution loss dollars and distribution loss percent. The five worse offenders were called out and identified as Fisher, Old Farm, Butler, Anderson Creek and Cape Fear substations. The losses at these five stations (2,636,657 MWh) represent 32% of the total megawatt-hour losses on the SREMC distribution system. They account for $189,524 in losses and produce a combined 6.68% losses. This would appear to be the most likely place to initiate an efficient loss-reduction program. Upon closer inspection, these stations happen to be the most heavily loaded stations on the distribution system. It is easy to speculate they might also produce the highest megawatt-hour losses.
When identifying distribution losses, the better starting point is to look at the percent-loss data. This data will provide the low-hanging fruit utilities are looking for in their loss-reduction programs. Note that when percent-loss data is used, there is a completely different set of “top five offenders.” As might be expected, these are some of the oldest stations and feeders on the distribution system containing predominately smaller conductor sizes but only average-size loads.
Where to Begin?
To calculate potential dollar savings, the 10 stations called out previously were used and a target loss of 5% was employed to identify potential percent of loss savings, kilowatt-hour loss savings and loss savings (bound by the red box in percent savings graph). Using a spreadsheet, systems-integrated data from AriesPro Analytics was assimilated, organized by station and sorted from greatest to least by kilowatt-hour savings. Loss-reduction analysis priorities will be the stations with the greatest percent savings opportunity (bound by the blue box in the figure below).
This data was captured during the period of Nov. 1, 2017, to Dec. 31, 2017, and represents an analytical view by substation. A similar view by feeder can be created to perform economic evaluations and establish loss-reduction priorities by feeder. Overall system savings can be calculated to determine potential annual savings. In this case, theoretically speaking, if all station losses presently above 5% were reduced to the target loss, annual savings would be 12,940 MWh with a dollar savings of $727,000. These savings represent roughly a 1.55% reduction in SREMC’s total distribution system losses. The amount of time and modeling required to perform loss-reduction studies and economic evaluations to achieve this 1.55% reduction in losses can be extensive.
Following is a review of loss-reduction opportunities that combine other facets of the utility business and provide shorter returns on investments.
Lighting Loss Reduction
In mid-2016, a lighting inventory and lighting change-out to LED program was initiated. This investment was established to create savings for members through energy reduction, reduced maintenance and loss of income recovery. Using data analytics, distribution losses associated with non-billed lighting energy usage were determine on before (pre-LED) and after (post-LED) cases.
Loss data indicates lighting represented 25% of distribution losses and 1.7% of total kilowatt-hours in the pre-LED case. It should be noted that 90% of the security lights employed were 175-W mercury vapor. After the conversion of all 24,500 lights to LED, lighting will represent 6% of distribution losses and 0.4% of total kilowatt-hours. This equates to distribution loss savings of 1.3%. Further calculations reveal a conversion program payback of 3.1 years, with a subsequent annual savings of $1.3 million in energy, maintenance and loss revenue recovery. This program provides a quick return on investment, coupled with a handsome annual savings, and proves to be a valuable program for distribution system loss reduction.
Transformer Loading Analysis
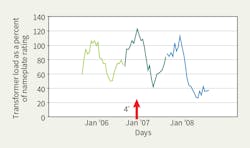
Other savings through AriesPro data analytics are easily quantifiable through transformer loading analysis. In the example below, a daily bad voltage alarm was received during a cold winter morning where temperatures had been in the single digits for several days. This alarm indicated voltage levels of 110 V to 112 V on eight meters.
When reviewing the GIS location of the meters, it was revealed they were all on one 75-kVA transformer. The homes at these locations were each 2500 sq ft to 2800 sq ft (232 sq m to 260 sq m) and all electric. In the initial inspection, it was believed the transformer was overloaded, however, data analytics indicated otherwise. The peak load on the transformer during 4°F (-15°C) temperatures that morning was 123% of nameplate rating, with the load remaining above 100% for 6 hours.
Ultimately, the transformer has been placed on a watch list and was subsequently found to be sufficient for its load. The AriesPro Analytics eliminated transformer loading as being a potential source of the problem and prevented dollars spent unnecessarily on a transformer change-out. The source of low voltage was correlated to primary voltage levels and resolved with downline regulator adjustments.
CVR Analysis
System peak-demand reduction is often achieved through voltage-reduction programs. The level of demand reduction is generally estimated from observations of demand trending graphics or calculated on averages based on quantities such as 1% demand reduction for each 1% voltage reduction. At South River EMC, peak-demand reduction is analyzed and estimated by the North Carolina EMC statewide group through various algorithms and weather-based regression modelling.
The quantities typically unknown in voltage reduction when activated are revenue losses in energy sales and savings in distribution loss reduction. Through near-real-time AriesPro data analytics, SREMC is now capable of determining these quantities and can report a more accurate savings: dollar savings = demand savings – energy revenue losses + distribution loss savings.
The Future Is Now
At South River EMC, the initial source of system loss data did not provide the granularity needed to identify high-loss areas of the system. Hence, SREMC was at a loss about the losses. The addition of data-driven analytics through AriesPro has afforded the opportunity to drive costs out of the business while embedding efficiencies in electric system design and operations. Additional phases of this project will migrate other aspects of the business into the utility data warehouse and will help drive demand response, outage management and other distribution management initiatives. At South River EMC, data analytics is not the future, it’s now. ♦
Chuck Richardson joined South River Electric Membership Corp. in Dunn, North Carolina, in 2012, and currently serves as vice president of engineering. From 1985 to 2001, he worked with Duke Power Co. in the fields of electrical system design, transmission planning and power quality. He served on the IEEE Low-Voltage Surge Protection Committee and was awarded several Innovator awards from Electric Power Research Institute for developing a power-quality database as well as for contributing to EPRI’s Low-Voltage Shocking Guide.


