Looking to take the next step in advancing its grid, Orange and Rockland Utilities has been focused on understanding a sensor product from Micatu Inc. The utility sought to place the sensor in the field to collect global positioning system (GPS), time-aligned voltage and current data (minimum, maximum and average) every minute, to compare current transformers (CTs) and potential transformers (PTs) measuring the same photovoltaic (PV) output. The utility wanted long-term testing to be performed on an actual overhead line instead of in a controlled lab setting. The challenge would be to placethe lab-grade data collection system in the field, connected to sensors and transformers on live conductors.
After Micatu had proven conceptually to Orange and Rockland Utilities (O&R) engineers that light can, in fact, measure electricity, a series of mock installations were put in place to establish all the work practices and standards required for a live system. This was followed by moving to a long-term field-test facility to provide the perfect real-world test environment for a meaningful sensor comparison analysis.
A highly granular view of voltage and current accuracy vs. traditional instrument transformers—both static and dynamic line activity, over long time periods—generates a tremendous amount of data. O&R’s first step was to provide high-accuracy power-quality (PQ) metering analog inputs to capture each type of analog-sensing secondary. The utility needed to be able to store the information in a database over weeks, months, seasons and even years. In addition, specific date- and time-range data exports as well as trending visualization software were needed to perform rough and fine analysis.
Data Collection
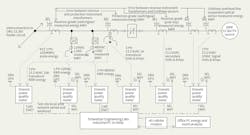
O&R engineers found Dranetz Technologies and Electrotek Concepts provided integrated systems that would satisfy the utility’s required data collection performance. Dranetz’s PQ hardware of mainframes and data nodes takes in the Micatu m410 modular optical sensor processor low energy analog (LEA) signals as well as the protection CT/PT analog signals for storage in a database. GPS, time-aligned root-mean-square (rms) minimum, maximum and average values are saved every minute for all voltages and currents.
This enables long-term analysis of several adjacent Micatu GridView RG235 sensor system-measured values vs. the CT/PT values for the same phase, without overwhelming the data collection software. The O&R revenue meter uses a pulse output to register accumulated energy every 1050 kWh, which is then used to compare to the protection and sensor system-measured energy for the exact same period. All these methods were used to understand the relative accuracy and precision performance of the sensor system.
Life Cycle Development
Field-testing resulted in ongoing refinement and hardening of the sensor system. Both O&R and Micatu routinely connected with the field-located computer to get the latest
++measurement results for all devices, including an adjacent weather station, for analysis. Micatu also had implemented an advanced temperature-compensation system to correlate secondary attributes and ensure optimal performance in all weather conditions.
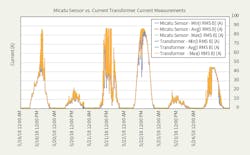
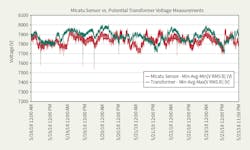
After several years of refinements and development, the results are significant. The sensor system can match the protection CT current measurement within a few tenths of an amp from 0 A to 80 A, even during a highly variable PV output day, for all values of minimum, maximum and average. Also, the sensor system voltage signal is within the protection PT value by 1.5% of 7620 VAC (full-scale) a majority of the time, and often within 1%. The worst outliers for voltage are never more than 3.2%, which rarely occurs.
Micatu had proven what sensor performance was possible; the final testing milestone was to establish what performance was probable. In 2018, O&R put four additional three-phase GridView RG235 systems in service at the test facility for factory-direct, calibration and performance-repeatability benchmarking. O&R also is placing orders for dozens of production systems for installation and commissioning in 2018.
Overall Objectives
The primary objective of this project is to ensure when sensors are deployed in the field, the measurements captured are reliable and can be trusted with no intervention. To prove this, the sensors must undergo trials of testing against known reference sensor sets to identify their performance in real-world conditions.
The test sensor’s data is compared against a reference sensor to determine both the accuracy and precision of its measurements. The sensor’s performance is evaluated by two criteria: percent error and standard deviation against the reference sensor. To determine the level of acceptable performance against these two criteria, the test sensor must supply measurements continuously close to the reference.
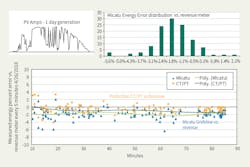
The first round of field-testing performed was to compare the energy measured between each three-phase sensor system at set intervals of time. In doing so, high-accuracy revenue sensors can be used as the reference node without tampering with instruments used for billing. There is a comparison between revenue- and protection-grade CTs/PTs that is useful as a benchmark of expected energy accuracy when charted with the Micatu vs. revenue-grade error plot.
This is a good first test as the energy being compared contains the current, voltage and relative angle readings in their calculations. If there is a large discrepancy with any component of energy, it is quickly visible within a comparison of this nature. However, this type of analysis does have some downfalls. It does not identify which quantity is inaccurate, and it is not very precise in the range of small errors. There also can be an error-canceling effect when lower current and higher voltage exists in equal proportion. To account for this, the same type of analysis is applied to each phase rms values of voltage and current independently for minimum, maximum and average values. The reference values used in this case are substation-grade CTs and PTs.
All outlier measurements are identified in steady-state and transient comparisons over long periods of time. This vendor awareness of product performance results in unprecedented refinement efforts over time. Future data analysis will compare individually the current and voltage to a future pole-top revenue-grade CT/PT cluster wired to a Dranetz PQ meter, which would be used solely as a reference node and not for billing. The rms minimum and maximum plots are useful for identifying when circuit transients occur. This pinpoints event-triggered oscillography captures that are overlaid for waveform accuracy comparison and differences in zero crossing.
Automation Package
With the Micatu GridView RG235 sensor system developed and refined sufficiently for production, O&R needed a deployment package beyond the experimental, one-off hand-assembled automation boxes at the test site. The sensor system needed to be integrated into proven production automation enclosures to leverage the high-accuracy voltage and current sensing in supervisory control and data acquisition (SCADA), operations and planning.
Fabricating an integrated automation solution as a panel shop is not Micatu’s business model; high focus on deployable optical-sensing technology is. Generally, in electric distribution, an appropriate automation and SCADA package is provided by the manufacturer of pole-top devices, such as O&R’s motor-operated air-break switch (MOAB) from Siemens. MOAB deployment has been a cornerstone of O&R’s grid modernization efforts but has lacked the advantages of sufficient, accurate sensing that can feed operational awareness into a distributed control system. This makes MOAB a top candidate for GridView sensor integration over time, but O&R had a more urgent use case first.
The utility’s first use case required a systems integrator to fabricate a production PQ box without the profit enticement associated with a pole-top device so the GridView RG235
could be deployed solely for sensing. O&R relied on the one vendor found that would provide automation- and cabling-only solutions, Cleaveland/Price Inc., to adapt the proven SCADA capacitor controller to include the sensor system. This solution was no more expensive as a stand-alone PQ-sensing box than as a SCADA capacitor controller box, and it would enable immediate pole-ready production deployment of the sensor system.
The SCADA capacitor and MOAB use led to O&R’s meter of choice, the SEL-734P, a programmable controller with PQ meter from Schweitzer Engineering Laboratories (SEL). O&R also contracted Siemens to integrate the Micatu GridView RG235 sensor system into its MOAB product. O&R will have the choice of swapping automation boxes and hanging the sensor system as desired while returning removed automation to Siemens for retrofit. Moving forward, voltage and current measurements along with PQ, power and energy values will be available in SCADA from several different automation packages.
Ready for Production
Feedback from O&R’s linemen helped Micatu to develop and refine its sensor system throughout the project. A final stage of development was required before proceeding with field deployment: How could sensible work practices and document standards be defined for all possible line scenarios? The linemen again worked with O&R’s mockups and provided feedback required to establish a safe and practical approach to the sensor system installation and maintenance.
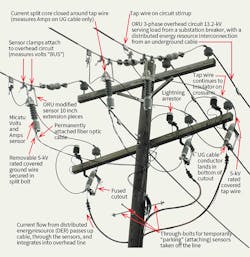
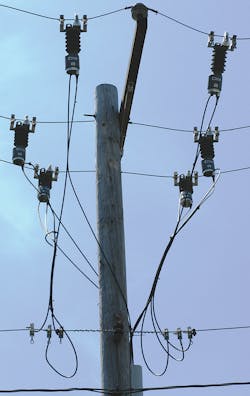
Based on their feedback, it was determined the sensor system would be hoisted and installed on a 12-inch (304-mm) bare section of overhead wire by using live-line work methods. The fiber cable would hang free below during this glove installation, and no ground wire would be attached to the sensor bottom’s split bolt until sensor clamps are tightened securely onto the wire. Both the covered ground and fiber-optic cable would be tie-wrapped together and fixed to the pole about 6 ft to 10 ft (1.8 m to 3.0 m) below the primary by tie-wrap to a pole staple. Extra fiber cable length would be gathered in a spool of loops and fixed to the same staple. The no-slack sensor ground wire would be attached to pole ground or neutral wire with a hot line clamp.
With a line-suspended sensor, a few challenges still needed to be resolved. How should O&R safely work on the primary line and pole top with three phases of fiber-optic cables and ground wire running diagonally down the pole? O&R engineers learned from linemen that getting the sensors mounted on the line is one thing but working on the pole safely with a series of cables and wires in the way is another.
As a result, O&R linemen developed a way to temporarily park the sensors out of the way when required. A lineman can remove the sensors from the primary position and park them on protruding rods just above the neutral, which provides clear access to the primary and pole top where the sensors had been. Upon completion of pole-top maintenance work, the linemen can once again place the sensor system in service by installing them in their original place on the line, not having to rearrange any other connections or material.
O&R also met the challenge of inventing a way to monitor underground riser construction using a modified line-suspended sensor system. Suspending a sensor on small gauge tap wire with crimp connections was not an option. O&R needed a way to sense the current on the riser tap wire before mixing with the circuit load current and still support the 12-lb (5.5-kg) sensor that also measures the voltage node. O&R engineering invented a modification for the sensor to be supported by the mainline wire, giving it mechanical support while enabling the tap wire current to be measured independently.
By extending the voltage-sensing clamps with 10-inch (254-mm) conductive rods, the sensor clamps onto the mainline for its support and voltage reference; this gives enough distance for the tap wire to be passed through a current-sensing iron core clamp. This methodology has the potential to be applied to other designs of line-suspended sensors, as well.
The location of the sensors and means of the underground-cable disconnect also presented a challenge. How would the disconnect device be operated with a hot stick if sensor cabling was in the way? The sensor needed to be positioned at the point of line connection, so the tap wire would travel first through the current-measuring clamp before landing on the disconnect device. This way the device operation with the hot stick will occur on the opposite side of the pole, away from the sensing cables.
Use Cases
The New York State Public Service Commission created an initiative known as Reforming the Energy Vision (REV), and part of that effort is to develop a new solution to monitor and control distributed energy resources (DERs) interconnected on the distribution system. O&R’s sensor meter system provides three-phase voltage and current monitoring to its SCADA system, with provision for the future capability of control. O&R’s serial radio communication network is bandwidth limited, so unique strategies for timely data reporting were required. This setup can monitor rms, power, energy and harmonic-calculated data on primary overhead lines. The meter can indicate voltage sag, swell, interruption (VSSI), flicker and other transient PQ indicators as well as remote event-based waveform capture.
To accommodate monitoring and control at O&R’s earlier DER installations, additional high-voltage PTs and CTs were needed as well as the engineering and labor to locate remotely the secondary wiring to a test switch box on an antenna pole for metering and SCADA communications. O&R’s new sensor system will mitigate the additional costs and resources required for utility monitoring of DERs. O&R’s meter of choice, the SEL-734P, will lay the groundwork for adding control options to this solution. With this sensing technology, O&R can apply monitoring to remote substations for head-end feeder data to obtain watts, volt-ampere-reactives (VARs) and power-factor readings for volt-VAR optimization applications; retrofit motor switches and SCADA capacitor controllers with full voltage transformer (VT) and CT sensing; and look to integrating this technology with underground switches.
JP Laglenne ([email protected]) is a principal automation engineer at Orange and Rockland Utilities Inc. with more than 23 years of automation and research and development engineering experience in numerous industries. For the past eight years, he has focused on product development and deployment for overhead distribution automation and overhead devices. He is a licensed professional engineer in the state of New York.
Brandon Peifer ([email protected]) is an automation engineer at Orange and Rockland Utilities Inc. Peifer develops programs for new distribution equipment and serves as a distribution modeling administrator for distribution planning studies.
Angelo Regan ([email protected]) is director of electrical engineering at Orange and Rockland Utilities Inc. He has more than 30 years of experience leading the technology transformation occurring at Orange and Rockland Utilities in distribution, substation and transmission. He is a licensed professional engineer in the state of New York and a senior member of IEEE.
Lou Colangelo ([email protected]) is distribution SCADA automation engineer at Orange and Rockland Utilities Inc. With more than 15 years of utility experience, he is now the remote terminal unit and distribution SCADA system subject matter expert and works on the utility’s ADMS initiatives. He is a licensed professional engineer in the states of New York and New Jersey.

