Every year, all major U.S. electric utilities provide financial reports to the Federal Energy Regulatory Commission, under requirements of the Federal Power Act. The non-confidential data involves several hundred pages of information for each investor-owned electric utility subsidiary on a state-by-state basis, across all aspects of operations and maintenance activities and capital assets and sales.
Given trends of interest, the overall spend of all U.S. investor-owned electric utilities can be sized up, and some of the results can be analyzed in interesting ways.
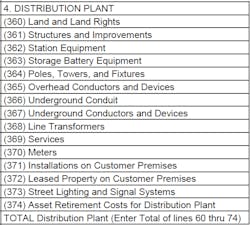
Consider, for example, meters, and battery storage equipment, two of the line items utilities report to FERC annually on the distribution side, off of the table below:
First, for a top-down view of T&D, total Distribution Plant in Service grew 5%, from $380 billion to $400 billion. The reporting involved 140 of the largest electric utilities in the U.S. Similarly, total Transmission Plant in Service grew 9%, from $182 billion to $202 billion, at 168 utilities.
When we talk about the investments required to fully integrate grid-edge renewables, it is important to recognize related “realities of scale.” Specifically, when we hear various multi-year, multi-billion market size predictions for technologies such as Thermostat-based Demand Responses solutions, or Advanced Battery Storage, it is important to see that the 2015 additions of new T&D plant in the U.S. totaled $40 billion, just at the large IOUs making up 70 to 80% of these investments. And another key part of that context involves each utilities’ obligations on behalf of their customers to get the most out of the existing 90 to 99% of their T&D assets they do NOT have to replace every year.
A Metering-related Snapshot
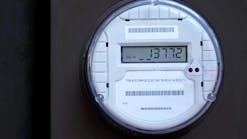
The current dollar value for all of the installed electric meters at the 137 utilities reporting distribution system assets to FERC was $16.8 billion at year-end 2015, up 10% from the prior year’s total of $16.6 billion. Putting aside some accounting adjustments in the figures, the dollar value of retired meters was 5.3% of the year’s starting figure, and additions of new meters was 8.1%. This means that reports about AMI related growth in the future should be tempered by asking what portion of meters failed and were going to be replaced anyway, and what portion of new additions of meters were due to growth in the utility’s customer base.
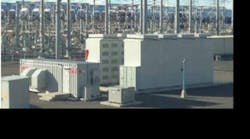
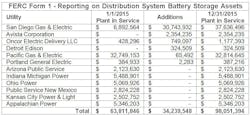
Looking at distribution system storage battery equipment, it is of interest that this is still a young and growing asset area, with only 13 utilities reporting any assets in this category, and with the top two utilities (SDG&E and PG&E) making up 72% of the entire market to date:
NERC CIP Snapshot
Finally, let’s put NERC CIP related spending in context. Shifting from Distribution plant in service to another category, transmission related expenses, there were 191 utilities reporting, with the total for all transmission system related O&M going from $11.8 billion in 2014, to $12.6 billion in 2015, an increase of $818 million (6.5%).
Since utilities with critical transmission and substation assets have started engaging in significant compliance work to meet NERC Critical Infrastructure Protection requirements, it is of interest to review some summary data on the related expenditures in light of the size of the overall transmission O&M spend just described.
While there is no NERC CIP related direct line item in the FERC reporting, some portion of capital projects which are not completed by year end do get reported in the category we know as Construction Work in Progress (aka CWIP). While it is not a comprehensive number and does not tell us the timing of these 2015 projects so as to project an actual total, it is interesting to see this 2015’s big uptick in NERC CIP related spending—free-form review of the comments associated with CWIP show at least $128 million was stated as the 2015 NERC CIP compliance related CWIP. This figure was reported across 67 projects at 19 utility subsidiaries. It contrasts with a much smaller figure of $16 million for 2014, which involved 9 utilities.
While FERC Form 1 specifies all data is non-confidential, we will not identify the names of the utilities involved in these projects. In all likelihood the spend in this category is growing and only partly covered by the figures cited here—it is likely ten or more times larger than indicated by these CWIP numbers.


