So, you’ve been following along through this multipart series (part 1, part 2, and part 3) and have fully embraced the Esri platform as the solution to your utility geospatial requirements for mapping, analyzing, and managing your GIS data. That’s fantastic and I’ll bet you’re reaping the rewards of your hard work and investment over the years. But hey, this is IT and we can never rest very long or the ever-progressing technical landscape will leave us in the dust!
As we discussed in part 1 of this series, GIS networks drive flow and hierarchy within our electric, gas, water, and even telco data. This connected data drives powerful analysis including directional tracing, protective device analysis, and true modeling of the flow of these critical commodities.
Interestingly, the foundational technology that Esri uses for this connectivity, the Esri geometric network, was introduced to the market all the way back in 1997 and has been implemented by almost all utilities that use Esri for connected tracing and related analysis. But in more recent years, we’ve begun to see changes in the operational demands being placed on the GIS by the business of the utility and that has driven exciting technological innovation.
New Requirements for Today and the Future
To expand on this concept, we are seeing new requirements from both the electric and gas businesses, but both are focused on more accurately modeling the underlying assets that we track within the GIS. Accuracy in this context is defined as modeling the assets more closely to how they exist in the field as opposed to genericizing or abstracting them within the GIS. For electric customers, much of the operational focus has shifted to advanced distribution management systems (ADMS) as well as distribution resource management systems (DERMS). While both of these systems provide advanced capabilities around decision making and analysis on the power grid, at the base level, they depend on accurate and detailed geospatial network and asset information.
On the gas side, we’re seeing a very directed movement toward modeling linear referenced transmission (high pressure) data alongside the distribution (lower pressure) systems. Historically, these two datasets have been modeled in differing GIS-based systems because of the technology required to support regulatory and operational tracking of the underlying assets (think TIMP and DIMP plans all regulated by PHMSA). However, in light of an increasing number of safety-related incidents and subsequent growing regulatory drivers, there is an increased need to model the data accurately within a single system/model to support joint transmission and distribution analysis and reporting.
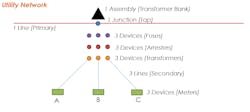
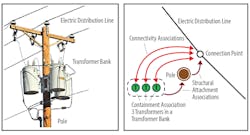
Further, in both the electric and gas business, there is a general desire to enable true asset management at a more granular level by tracking the smaller internal components of locations and devices that may have been previously modeled as a single composite location in the past. An electric example would be a transformer bank. In the past we may have modeled three individual overhead transformer devices at the same location as a single point on the map. Now, we are seeing some consumers of this data require the three individual transformer assets to be modeled and, in even more granular cases, the related fuses and lightning arrestors that exist as part of the transformer. That single transformer point has now been expanded to three or even nine map features!
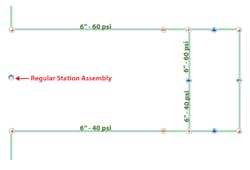
In the gas world, the best example is a regulator station. In the past, a regulator station was typically modeled as single point asset whereas in reality, the station contains multiple components including pipe, valves, elbows, and regulators. All of which have regulatory inspections associated with them and therefore benefit from more granular modeling in the GIS. In both electric and gas, the goal is to have the GIS accurately mimic the real life assets to enable better tracking, inspections, maintenance, and to enable this data to be passed to related, integrated systems that require this granularity to enable new, advanced algorithms that are driving the business of the utility into the future.
What Will Get Us There?
The mature Esri geometric network (GN) isn’t able to accommodate these requirements for a number of reasons which are too vast to go into today. However, importantly, Esri identified this shift in the future operational requirements of utilities many years ago and began investing in a new GIS extension called the Esri Utility Network Management Extension (utility network). The express intent of the new utility network is to provide a foundation for the increasing technical demands being placed on the GIS in both the near and distant future. To effectively create a geospatial platform that will support the business of the utility for the next 20 years just as the geometric network has supported our needs for the past 20 years.
With the new utility network comes new industry data models. These are the first Esri-driven models that specifically incorporate capabilities designed for utilities. This includes modeling utility tiers. For electric, these are voltage tiers such as generation, transmission, and distribution voltages. For gas, these will include gathering, transmission, and distribution systems.
The models further support the additional granularity mentioned above by allowing us to create individual, connected assets in a way that truly mimics the real world. To support this granularity, the new models support non-coincident connectivity (for example, point-to-point connectivity without connected lines), support for structures (poles, pads, vaults) to be included in the network, and the concept of containment (that is, having a container feature on the map that can be “opened” to reveal the internal asset components — think back to the regulator station example above).
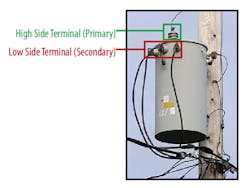
Finally, the utility network supports terminals on our devices which can drive specific connectivity rules within the network. The easiest electric example is a transformer device which has a high side that taps into the primary voltage lines as well as low side bushings that are connected to the outbound, lower voltage secondary lines. For gas, an easy example is a regulator which has high- and low-pressure connections as well as directional flow from the high to the low side through the regulator. The native utility network model supports all of this capability and more.
The Model Is Just the Beginning
Beyond the data model, new utility network functionality has been built directly into the server extensions as well as Esri’s new desktop application, ArcGIS Pro. This functionality includes items like utility-specific tracing (upstream, downstream, protective device, isolation traces, and so forth), support for configurable phase propagation within an electric circuit, and new, powerful feature placement and editing templates to assist users in managing the underlying granular data models. With that, Esri is now able to natively manage our electric circuits including transmission, distribution, and downtown mesh networks as well as our gas pressure systems, cathodic protection circuits, and our emergency isolation zones.
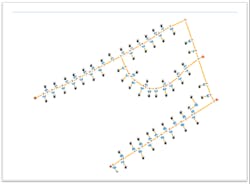
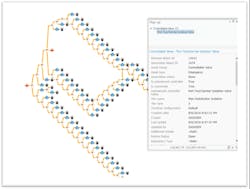
One of my favorite aspects of the new utility network is its native support for ArcGIS diagrams. This allows us to take the results of any utility trace and view them as a schematic diagram using one of many out-of-the-box templates. This is particularly valuable in very congested areas on the map (downtown cities) that need to be expanded or very rural, sparse areas which need to be condensed. Some utilities had previously implemented the ArcGIS schematics extension (with a fair bit of extra work) with similar goals but this new diagram functionality is now available directly in the utility network with little to no additional configuration.
The Esri utility network was first released in January 2018 and the first large utility implementations are already well underway. As these early adopters achieve success, we expect the rest of the market to begin their move from the geometric to the utility network to allow them to take advantage of the numerous benefits outlined in this post. This transition should be undertaken with care to ensure these benefits can be realized while mitigating known risks. We’d heavily recommend a road mapping and planning phase to ensure all of your critical stakeholders have provided input into the utility network implementation and are on board with the move. This phase can also be useful in establishing your unique business case around the shift to the new technology. And then you’ll be off to the races to start your own implementation of the Esri utility network!
In summary, Esri has provided the utility network a new, foundational platform to allow utilities to rise to meet the ever-increasing demands of the operational side of their business. And the intent is that the utility network will support those requirements today but will also be flexible enough to support the new requirements and challenges that will inevitably be placed on the GIS in the coming 20 years. If you haven’t begun to plan your journey to the utility network, now is the time and that starts with education and planning! Understand where you are today, where you’re going with the utility network, and how you are going to get there. Then hold on and begin to embrace the exciting change that is upon us!
