Grid Reliability and Resilience: Leveraging Advanced Analytics and AI
The reliability and resilience of today’s distribution grid face significant challenges, including the rise of DERs, the threat of wildfires, aging infrastructure, and severe weather events. Fortunately, new advancements in digital technologies, specifically advanced analytics and artificial intelligence (AI), offer breakthrough solutions to address these challenges and make high-impact improvements to grid reliability and resiliency.
A few years back, the number of utilities seriously using advanced analytics and AI to improve operations was small. According to IDC’s 2020 survey, 30% of utilities put a high priority on investment in projects tied to analytics and cloud-computing.
Change is happening, and today, many utilities now list data analytics as a priority in their strategic plans. Each week, more are moving past asking “will we use analytics?” to “how will we do this?”. If your utility is ready to take your analytics journey to the next level, here are a few key considerations for building a proven roadmap to enable data-driven grid transformation.
The Data Must Be Good
The output of analytics applications is only as good as the underlying data. Higher-resolution data yield greater outcomes than low-resolution data. However, high temporal or spatial resolution comes at a cost. Data must be transported, stored, and managed. Therefore, the resolution of data must be balanced with cost.
Nearly all utilities manage and control their grids using SCADA systems. SCADA provides real-time situational awareness of the grid’s current state at few locations and facilitates actions to address problem areas. DNP-based status is collected from devices in substations and along feeders every few seconds by the SCADA system. Typically, this system scan rate is every two to five seconds of the interval RMS data. One could say 12-30 samples per minute is the default temporal “resolution” of grid monitoring systems. This allows utilities to detect faults and create satisfactory event reports with data at this resolution.
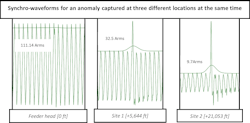
When utilities begin to utilize grid data at higher temporal and spatial resolutions, breakthrough use cases emerge. For example, capturing higher-resolution synchronized data a.k.a synchro-waveforms at multiple locations allows utilities to identify grid anomalies that precede permanent faults. If the data capture is high-resolution (e.g. orders of magnitude better than SCADA), predictive analytics can be applied to detect seemingly minor disturbances such as precursor anomalies. When the precursor anomalies increase in frequency or severity, the data can be used to predict and preempt outages caused by equipment failures or vegetation contact. In addition, higher-resolution data can identify and address more complex grid challenges, like determining the root cause driving the anomalous behavior in the grid leading to wildfires.
Edge Data Processing is Critical
High-resolution data capture is a key element of predictive outcomes for reliability enhancement and wildfire prevention; but as mentioned earlier, there is a cost to data storage and transfer. An optimized way to make high resolution data capture work is to process data close to the collection point or apply edge analytics For example, intelligent line sensors can capture data at 130 samples per cycle or better and automatically reject the noise i.e. unwanted signals to keep only the useful data. Using edge analytics, the utility then only must transmit, store, and manage the minimum data necessary for effective grid management applications.
Consider Data Capture Density or Spatial Resolution
The proximity of sensors—capable of producing synchro-waveforms—to events plays a crucial role in data resolution and accuracy, especially with power system transients. Just as sound waves get muffled over distance, power system transients attenuate as they travel along conductors. This is especially true for precursor anomalies, which tend to be higher frequency and therefore don’t travel far. Also, these anomalies can be modified by circuit components such as capacitor banks and conductors. Therefore, sensors must not only be high temporal resolution, but they need to be cost effective to place them in several locations along a feeder to achieve adequate spatial resolution in data.
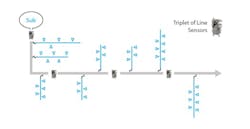
When deploying line sensors, a recommended best practice is to position them at the head-end of the feeder and at the quarter points at the minimum. By adopting this approach, utilities with four sensing locations can capture important synchro-waveforms, such as precursor anomalies along the entire feeder. This aspect of sensor density is critical because relying solely on data captured at the substation is often insufficient for enabling predictive analytics along the entire length of feeders. While monitoring the first quarter of the feeder may exhibit adequate resolution, as one moves further down the feeder, the presence of valuable precursor anomalies becomes increasingly difficult to discern and locate due to natural attenuation and muffled signals.
Can the Solution Scale Cost-Effectively?
When building your utility’s analytics roadmap, it is crucial to consider the scalability of the solutions. While scalability may not be a primary concern during a pilot, it becomes a critical success factor for broader rollouts. There are two critical elements of scalability to consider: (a) install effort for a system wide deployment and (b) on-demand storage, compute, and processing power expansion of software without manual intervention and costly IT projects.
Sensor Hardware Installation Times
To address many challenges in utilities, the installation of new hardware, like intelligent line sensors, for data capture is often necessary for higher resolution data to enable effective analytics applications. Also, utilities many need to capture data from new locations along distribution circuits to fill in data gaps.
When scaling up projects, its crucial to minimize field installation times. For example, during a pilot, a utility might target eight feeders for instrumentation. If sensors are installed on all three phases at four feeder locations, a total of 96 sensors must be installed. However, in broader rollouts, hundreds of feeders may be outfitted with thousands of sensors, making installation times highly significant.
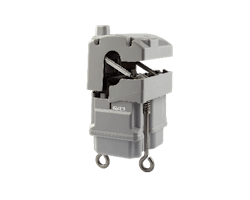
Consider the design of an overhead line sensor like the device shown in the image. This sensor has multiple attributes that facilitate quick installation and make it well-suited for project scalability.
- Clamp-on installation: The sensor can be clamped on to the line using a hot stick. This eliminates the need for separate current transformers (CT), coils or complex connections. The sensor’s chassis contains the entire system, simplifying the installation process.
- Integrated wireless communication: The sensor incorporates cellular wireless communication and antenna within its chassis. This eliminates the need for installing separate communication gateways in proximity to the sensor locations. Line sensing solutions with separate communication gateways are less scalable due to time-consuming installations and the requirement of additional pole-top transformers for gateway power, increasing the total cost of ownership.
- Power harvesting: The line sensor is powered by harvesting energy from the feeder conductor. This eliminates the need for batteries in the sensor and, importantly, eliminates battery maintenance processes that can hinder scalability and increase cost.
Analytics Software Platform Scalability
Utilities should also prioritize the scalability of software solutions for their analytics use cases. It is essential to choose software that supports fleet management capabilities, allowing for easy configuration and updates of sensors in batches. The goal is to make managing 1,000 or 10,000 sensors as effortless as managing a single sensor.
Another critical aspect of software scalability is leveraging elastic compute technology. While most utility operational technology (OT) systems like SCADA and ADMS are hosted on premises, analytics applications have shown greater effectiveness when deployed in an elastic compute environment. Cloud deployments offer seamless scalability, requiring fewer resources from utility IT teams. This is particularly important because as the volume of data collected increases, necessitating scalable storage, compute, and processing power, required IT hardware also increases. Relying on physical hardware in a managed datacenter poses limitations in this regard. In contrast, a cloud-hosted solution that can automatically scale on demand within minutes eliminates the IT hardware barrier.
Final Thoughts
The future is now for advanced data-driven applications to unlock the next breakthroughs for grid reliability and resiliency. The convergence of ubiquitous wireless communications, intelligent sensor technology with native synchro-waveform capture capability, edge processing, AI& machine learning, and cloud computing opens significant improvements for data-driven grid transformation. As you guide your utility into this exciting new frontier, it is crucial to maintain a focus on the temporal and spatial resolution of data captured, data processing technology, and scalability from both hardware and software perspectives. By maintaining focus on these areas and selecting experienced solution providers, utilities can navigate the transformative world of advanced analytics and AI with confidence and realize enhanced operational efficiency, safety, and increased customer satisfaction.


