In a peninsular service territory characterized by frequent high winds, heavy rain, lightning storms and salt-soaked ocean breezes, keeping the lights on is no small challenge. In Florida, lightning strikes alone are at their highest levels since 2005.
In the past, Florida Power & Light Co. (FPL) has stayed ahead of the game by continually finding quicker, more efficient ways to locate a problem on its grid and fix it — in essence, becoming a well-oiled restoration machine, with new and better procedures to minimize customer interruptions. But this paradigm will only go so far.
To achieve aggressive system average interruption duration index (SAIDI) goals, FPL adopted the philosophy that the best defense is a good offense. FPL is pushing forward with full-scale deployment of advanced line sensors that have the potential to identify problems even before they cause a power outage.
Phase One: Faster Restoration
FPL’s well-defined outage-restoration process was not unlike the model used by many utilities: send a restoration crew to a predefined midpoint switch, open it and then try closing the breaker. If the breaker held, this indicated the fault was downstream of the midpoint switch. If it did not hold, the fault was somewhere between the switch and the substation. Once the direction of the fault was identified, the FPL crew would start patrolling to look for the cause of the fault and opportunities to further isolate the circuit. Although this process has been effective and enabled FPL to achieve some of the best SAIDI scores in the United States, the utility recognized it was both time-consuming and resource-intensive. There had to be a better way.
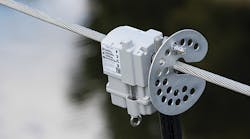
As part of its Energy Smart Florida program, FPL deployed approximately 3,000 Sentient Energy overhead distribution line sensors between 2013 and 2014. The goal of the pilot program was to improve the utility’s "first-part-on" response, which is the time it takes to do the initial restoration after a fault event occurs. FPL used the intelligent sensors to segment feeder lines into smaller sections. Initially, the utility installed an average of two sets of sensors per feeder circuit, splitting the feeder circuit into thirds.
FPL expected the feeder breaker to provide fault indication for the first third of the feeder circuit; however, its initial pilot program showed this approach did not perform as expected. The breaker fault flag cleared itself after 30 seconds, which did not provide enough time for the dispatcher to get a clear indication of a fault in the first third of the feeder. Instead, the dispatcher got an immediate indication when the fault was in either of the other two sections of the feeder, which potentially reduced the patrol distance by up to 66%. The pilot program showed FPL the potential of this technology to reduce both the restoration time and the length of customer interruptions.
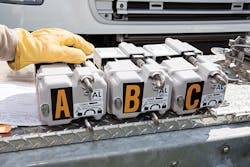
Based on the success of the pilot, FPL expanded its deployment to include Sentient Energy’s newer advanced sensor, the MM3. FPL adjusted its approach to account for the lessons learned from its pilot. The utility started by subdividing feeders even more — into fourths — to further reduce the patrol distance and increase the number of customers restored with the first-part-on response. FPL’s deployment plan includes more than 20,000 sensors covering a large portion of its 42,000-mile (67,600-km) overhead distribution network, which spans approximately half the state of Florida.
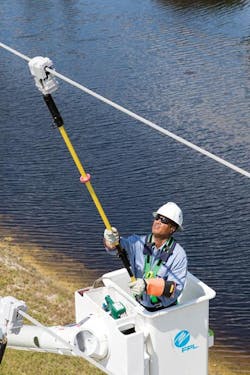
Although the deployment timetable was ambitious, it was feasible because the sensors generate power from the magnetic field surrounding the wires, so they do not require any pole-mounted equipment. Crews were able to install the sensors quickly using a hot stick. Most importantly, where the sensors were already activated and commissioned, network events such as faults were communicated trouble-free to the supervisory control and data acquisition (SCADA) system and distribution management system over the mesh network, which, in itself, was a major milestone.
Phase Two: Mining the Data
Reducing the time it takes to locate and restore an outage is an essential part of any reliability program, but preventing the fault in the first place is the Holy Grail. FPL recognized early on the industry’s widely used fault circuit indicator technology was not up to the task. A more advanced sensor platform, synchronized to a single GPS clock and capable of capturing high-resolution oscillography, was critical to creating a full-grid analytics system.
High-resolution waveform data is the heart and soul of this system. Waveform data contains the fingerprint, or signature, for every grid event — permanent, momentary or transient. Once this waveform data is collected, catalogued and analyzed, it is possible to identify an event and its immediate cause, such as vegetation, lightning or animal intrusion. It also is possible to identify many underlying conditions that lead to failure, like corrosion or faulty equipment.
Just as smart watches, smart sports bands and smart running shoes provide technology to monitor a person’s health and fitness, distribution line sensors are the new utility "wearables." These smart sensors monitor the health of the electric distribution system. They continually watch for even the smallest anomalies and allow for remedial action before a failure. And what better place to locate these wearables than the main feeder lines that come straight off the substations. This part of the distribution grid only accounts for 1% to 2% of interruptions, but each of these interruptions can affect as many as 5,000 customers. Almost all of FPL’s customers now have smart meters, and the utility is in the process of digitizing its entire substation network with electronic relays. The distribution lines are a focal point for improving reliability with intelligent sensors.
FPL is still in the early phases of taking full advantage of this technology, but its team has begun collecting and analyzing the waveform data on fault events. In the first three-month test of 2,000 sensors, 7,000 waveform signatures were collected. Sentient Energy is currently collecting and cataloguing these waveforms into its Ample analytics software platform. The vast majority of these waveforms will not contain enough information alone to identify a piece of failing equipment or a situation in the field that requires attention. For this reason, FPL engineers are working with the vendor to build an analytics platform that can analyze this flood of information to find the proverbial needle in the haystack.
Phase Three: Intelligence to Resiliency
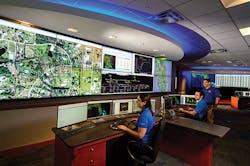
For the third phase of its deployment, starting in 2016, FPL’s Power Delivery Diagnostic Center will gather and analyze waveforms from transient events, also known as non-fault events. Transient events occur more frequently on the grid, although they do not always result in outages. It is a more challenging task to find the critical information hidden in this larger pool of data. While the problem of categorizing, filtering and sifting through the data is more difficult, if done properly, the exercise could have tremendous value.
FPL would like to discover if these waveforms hold the key to accurately predicting future equipment failures. This could help the utility to understand subtle nuances in grid performance that indicate areas of potential problems such as encroaching vegetation or tracking insulators. The challenge is identifying and separating the waveforms that are valuable from the majority that are not. Automation is essential. Sending a crew to investigate and remediate an issue before it triggers an outage can be more cost-effective and efficient than repairing a fault after it occurs. It also can save FPL customers the cost and frustration of experiencing an outage.
Eventually, FPL could use this data to improve the design and configuration of equipment for greater resiliency. In time, sharing these waveform libraries between utilities might lead to the creation of a standard industry library that takes into account variations in grid voltage and fault current levels.
Just how accurate will these sensor systems become? It is simply a question of better and better analytics software, some of which resides in the individual sensors and enables them to recognize and transmit precise information immediately from the site of an event.
Innovation Forum
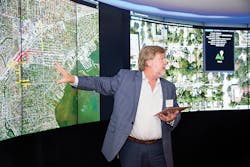
In October 2015, FPL hosted its first Innovation Forum in Jupiter, Florida. At this unique event, leading electric utilities were able to share thoughts on reliability, technology and safety. The use of intelligent sensors and analysis of complex waveform data was a major topic of discussion. One engineer quipped that as the technology continues to advance, "someday we’ll not only know if a fault was caused by a squirrel, we’ll know if it was a gray one or a brown one."
There is so much new technology coming into an industry that is ripe for technological change. Advancements in distribution line sensors and waveform analytics are creating real, measurable benefits for FPL’s customers and could help to set a new bar in the industry for grid reliability.
Rick Teigland is a principal engineer in the power delivery reliability grid automation strategy department and has worked for Florida Power & Light for 27 years. A registered professional engineer in the state of Florida, he holds a BSME degree from the University of Florida and a MBA degree from the University of South Florida.
David Herlong is the power delivery director of smart grid and innovation at Florida Power & Light.
