Intelligent electronic devices (IEDs) are one of the most powerful tools in an engineer’s toolkit to improve feeder reliability. They have the ability to isolate outages and restore service remotely to customers in unaffected sections of the feeder, all with a myriad of combinations of time-current characteristic (TCC) curves, features and custom logic. But to realize maximum improvement, the correct device needs to be in the proper location.
Every distribution feeder is different, so there is no one-size-fits-all guide for IED placement. However, two important quantifications of reliability improvements can be used to rank device locations.
SAIDI and SAIFI
The two most common industry-wide system reliability standards are the system average interruption duration index (SAIDI) and the system average interruption frequency index (SAIFI). These indices, or a form of the calculations, can be brought down to the feeder level to review individual outages and proposed improvements.
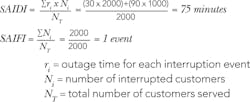
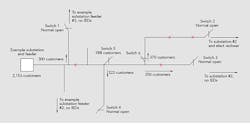
Following is an example of SAIDI and SAIFI improvements at the feeder level from the strategic placement of IEDs. The first calculations are done before any IEDs are proposed on the feeder and manual switching is required to restore service. There is a permanent fault at location A and the breaker is open. Thirty minutes into the outage, switch 1 is opened to isolate the fault. The breaker at the substation is then closed, restoring service to 1000 customers. Two hours after the outage started, repairs are completed and switch 1 is closed, restoring service to the remaining 1000 customers. SAIDI and SAIFI at the feeder level for this event can be calculated as follows:
The simpler set of values to calculate is customer minutes interrupted (CMI) and customer interruptions (CI). CMI is the numerator in the SAIDI calculation and CI is the numerator in the SAIFI calculation. The CMI and CI values provide a more tangible and accurate quantification of individual outage events. CMI and CI for the previous example are calculated as follows:
The second set of calculations is performed with an IED (electronic recloser) installed in place of switch 1. Now, instead of the breaker opening for the fault, the recloser opens. The repair time is still 2 hours. CMI and CI now are calculated as follows:
CMI — and, therefore, SAIDI — was reduced by 20%;
CI — and, subsequently, SAIFI — was reduced by half with the addition of one IED. But it is obvious if the permanent fault is located between the substation breaker and the recloser, the entire feeder is out until manual switching is performed. That is, the electronic recloser is opened and the normally open switch is closed, restoring half of the customers. The CMI and CI calculations for the outage would look similar to the first set of calculations.
Restore Customers Remotely
The goal is to restore customers remotely, no matter where the fault is located. IEEE 1366 defines sustained outages as having a duration of 5 minutes or longer. If customers can be restored within 5 minutes, CMI and CI will be improved. Regarding the simple feeder example, the addition of two IEDs is necessary. The first device would be the previously mentioned electronic recloser. The second would be a supervisory control and data acquisition (SCADA)-controlled switch, replacing the normally open switch. This would ensure, no matter where the fault is located, 50% of the customers could be restored quickly.
This example feeder is simple. Rarely are feeders in the distribution world this easy to automate and realize CMI and CI improvements of this magnitude. More commonly, distribution feeders branch in several different directions, and faults are of different types and located all along the feeder. Other hurdles on the feeder include the location of critical customers, existing devices already on the feeder and TCC curve margins, also known as device coordination.
Full Feeder Studies
Realizing the maximum CMI and CI improvement from IEDs in a fault location, isolation and service restoration (FLISR) system hinges on one main point: the proper device is in the correct location. A full feeder approach is required to be taken. Outage data from the feeder needs to be collected from the past three years. Three years of historical data will capture recent outage trends and several seasons of weather- and storm-related outages. Hopefully, the data also will include a tree-trimming cycle. The goal is to see the number of tree-related outages at the end of the trimming cycle and the reduction of outages after the trimming was complete.
The outage events and duration are then plotted on a one-line diagram, or drawing, of the feeder. This is a visual representation of where the faults are occurring. Customer counts for the entire feeder, tap points and main line switches are also included in the one-line diagram. This information will be used later in the calculation of CMI and CI reductions. Additional information needed in the one-line are the adjacent feeders and their nearest upstream protection. That is, on the other side of the normally open switch, is there an IED or does it feed directly off the substation breaker? Critical customers and areas of large customer concentrations are useful to know, as well.
The feeder will reveal itself once the outage data is plotted on the one-line. A midline electronic recloser is a good place to start for potential improvements. Hopefully, there is a location along the main backbone of the feeder where the placement of a recloser would reduce the outages on the substation breaker by half and the customer count is roughly cut in half. If that point does not exist or if the feeder has an extremely long backbone, another solution would be to divide the main feeder into thirds and propose two electronic reclosers. Other times, a feeder does not have an obvious backbone feed. It is a series of main line taps that spider away from the substation. That case would lead to identifying the taps with the most outage events and greater customer counts.
Next Steps
After locations of the main line IED are proposed, the next step is to evaluate remote restoration of the device’s downstream customers for an upstream fault. This is similar to the second example given earlier with the fault between the substation and the electronic recloser. If the faults are distributed fairly evenly across the feeder and the customer count downstream of the electronic recloser is significant, automating the normally open switch will provide substantial CMI and CI reductions. Often, there are multiple normally open locations downstream that can be automated.
Knowing the adjacent feeder’s configuration is a must. One switch may feed directly from the substation breaker while another switch may feed from a midline IED. The typical selection of which switch to automate is the one feeding from the IED. This will allow the newly automated open point to restore customers on the adjacent feeder up to the IED for that particular substation breaker outage.
The location of critical customers is a factor in deciding where to locate IEDs. The goal is to have the critical customer located in the section of the feeder that experiences the fewest outages. It also is beneficial for the customer to be in a section that can be restored remotely for an upstream device outage. Each critical customer should be evaluated individually. Pertinent data for the customer includes answers to these questions: Are they part of an automatic source-transfer scheme? What is their threshold for outage duration? What type of customer is it (for example, a hospital, large manufacturing facility or public works facility)?
There is a simple criterion to determine the most useful IED locations versus those that were merely nice to have. Most likely, budget and other constraints will allow a limited number of devices per feeder. The measure is CMI and CI saved. What-if calculations are performed for each device using the three-year outage data. If a particular IED were in place, how many CMIs and CIs would have been saved versus the original outage? This is where the customer counts for critical points on the feeder are needed.
The IED will reduce CMI and CI in one of two ways: reducing the number of customers who experience the outage or allowing remote restoration (in less than 5 minutes) of customers by a FLISR system. The IEDs are then ranked by the CMI and CI saved, which translates to reductions in SAIDI and SAIFI.
There needs to be a cost benefit assigned to reliability improvements. This is the amount the utility is willing to spend per CMI saved. The cost of the feeder automation project divided by the projected CMI saved produces this value. This cost benefit is compared to the utility target (for example $0.50 per CMI saved). Projects that have a lower cost benefit have a greater return on investment. Multiple projects should be ranked and constructed using this cost benefit analysis; this ensures the utility is receiving the greatest returns (SAIDI and SAIFI reductions) for investment.
Which IED to Choose?
Again, the main point to realize maximum CMI and CI savings is the proper device in the correct location. The aforementioned procedure is to identify and rank device locations. The proper device type is crucial to maximizing the service improvement to customers. Most devices fit into one of two categories: reclosers (also known as breakers) or switches. Reclosers are fault interrupting, while switches rely on an upstream device to interrupt the fault current. Both can be programmed with a variety of operating profiles and protection features.
Reclosers are the device of choice for clearing faults and maintaining uninterrupted service to upstream customers. The recloser control can be programmed with a multitude of protection profiles, TCC curves and reclose intervals. If coordinated properly for the individual location, the recloser will clear the fault without interrupting service to upstream customers.
IEDs in the switch category are rated to interrupt load current, but not fault current. Similar to recloser controls, the switch control has many features that can be used, if desired. One important feature is the ability to sectionalize after a set number of shots. A shot is defined as fault current followed by a loss of source voltage. When the switch counts a shot, there is a downstream fault and an upstream device clears the fault. After the switch counts the programmed number of shots, the switch opens during the recloser interval of the upstream device and isolates the fault. The upstream breaker closes, restoring service to some customers. Electronic switches set up as sectionalizers are excellent tools to further divide the feeder, saving CMIs and CIs.
Switches are the obvious choice for normally open switch locations; their primary purpose is only to open or close, not to interrupt faults. Reclosers are the clear choice for midline and tap protection; their primary purposes are to interrupt faults and isolate sections of the feeder without affecting upstream customers. Advanced feeder schemes include multiple switches and reclosers.
Only a finite number of fault interrupting devices with TCC curve protection can be placed in series and preserve device coordination. The number of devices depends on a few factors, including the last protection device on the feeder being coordinated, coordination margins, load current and available fault current on the feeder. When it is not possible to coordinate a recloser and the associated TCC curves, an electronic switch set up as a sectionalizer is a fine alternative. The downside is that all the customers downstream of the breaker or recloser will experience momentary outages, but only the affected section will experience the sustained outage. The CMI and CI savings are still realized.
Location, Location, Location
Improved feeder reliability is a goal of all electrical utilities. The tangible portion of system reliability is SAIDI and SAIFI. Simply put, devices interrupting faults affecting fewer customers improves SAIDI and SAIFI. The tools used are IEDs with an emphasis of the proper device in the correct location. Electronic reclosers and switches are versatile devices that can create elaborate protection and isolation systems. The method for locating and ranking IEDs on a feeder is CMI and CI savings per device. An electric utility can realize greater SAIDI and SAIFI improvements by adding these devices to a FLISR system.
Robert Reepe ([email protected]) is a distribution reliability engineer for Georgia Power Co., responsible for system reliability, protection and reliability improvement projects. He has 10 years of service with Georgia Power, all within distribution operations, and has been part of the reliability team for four years. He holds a BSEE degree from Georgia Tech and is a licensed professional engineer in Georgia.
Mentioned in this article:
Georgia Power Co. | www.georgiapower.com


