Protecting Business Means Helping Customers Navigate a Rocky Economy
Power and gas utilities can benefit from a focused understanding of the potential impact on their business. Last year, more than half of U.S. consumers had their income negatively impacted by the pandemic. According to the TransUnion Consumer Financial Hardship survey (Nov. 30, 2020), 57% of U.S. households indicated that their income had been negatively impacted.
TransUnion's monthly Financial Hardship survey data reveals that as many as 77% of U.S.-based consumers who have had their income impacted may have trouble paying their bills. This level of unpredictability underscores the need for power and gas utilities to not only provide great experiences for customers but also understand them more closely with insights that may predict when they are in temporary trouble or are experiencing something worse.
Financial Hardship analysis highlights:
- Impacted consumers that indicate they are unable to pay either their wireless bill, internet bill, or utility bill are experiencing greater levels of hardship than the average consumer.
- 24% of respondents have received a financial accommodation such as a deferral, forbearance, or payment holiday from a lender.
- In the absence of financial accommodation, 23% of consumers said they prefer to create a repayment plan to catch up by making larger payments, but keeping the loan terms the same.
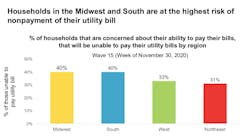
- Geographic region: According to TransUnion's November Consumer Hardship Survey, the Midwest and South have the highest percentage of households that indicate they will not be able to pay their utility bills at 40%, respectively. The West region is second at 33%, followed by the Northeast with the lowest percentage of non-payers at 31%.
- Generation: Gen X consumers are the most likely to miss a utility payment, with 43% saying they will not be able to pay their bill. 41% of Boomers with a utility indicate they are not going to be able to pay their bill, followed by Millennials at 38% and Gen Z consumers at 24%.
- Environment: Rural households are at the greatest risk of non-payment of their utility bill, with 43% saying they will not be able to pay. Urban and suburban that indicate they will be unable to pay their utility bill is a bit lower, at 36% and 34%, respectively.
- Income: Income is the most predictive demographic in determining the risk of non-payment of a household's utility bill. 43% of households with an income less than US$50,000 indicate they would be unable to pay their utility bill. The income range between US$50,000 to US$100,000 decreases to 34%, and for those with an income greater than US$100,000, 27% are unable to pay their utility bill.
Regular and predictable revenue is the lifeblood of power and gas utilities. Now these organizations need to manage their business and help customers in the short term. They can do this by understanding them more closely with financial and credit information that paints their picture individually as they navigate a changing economy.
The Consumer Financial Hardship study was originally launched the week of March 16, 2020. 15 waves of the study have been conducted through Nov. 30, 2020. The total sample across all 15 waves is equal to 39,895. Surveyed adults are 18 years of age and older, residing in the United States. An online research panel method has been followed. The responses are balanced to ensure a national representative sample. Results are unweighted and statistically significant at a 95% confidence level within ±1.76 percentage points.
About the Author
Rachael Olson
Rachael Olson serves as director of strategic planning for TransUnion, where she leads market development for TransUnion's Communications, Utilities, and Solar lines of business.

