Texas Co-op Shifts to Condition-Based VM
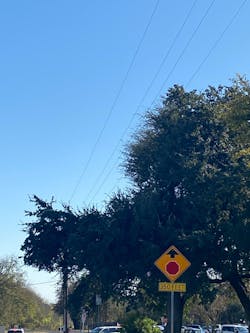
Electric utilities, which maintain large areas of distribution line corridors over vast areas and widely varied environmental conditions, face the challenges of keeping up with vegetation maintenance cycles and budgetary limits. Traditional, cycle-based approaches to tree trimming lack the insight utilities need to make the most accurate decisions about where to allocate their time and resources within the network. Under a cycle-based approach, many managers are forced to guess which areas are at highest risk due to vegetation encroachment and which areas should be prioritized over others.
Managers may wonder how to extend their knowledge and insight to make decisions that will optimize maintenance spend to target the areas that matter most. For example, one cooperative has adopted technology that can deliver timely and trustworthy information about the true condition of vegetation throughout the entire network.
Pedernales Electric Cooperative (PEC) has been using new technology in vegetation maintenance to bring value to its membership. The cooperative has recently become one of the only utilities in North America to exchange a traditional cycle-based, time-sensitive approach to vegetation maintenance in favor of a 100% condition-based maintenance strategy. Adopting a new approach to remote sensing, using a combination of Geiger-Mode LiDAR and high-resolution spectral satellite data, PEC has gained access to extremely precise imagery combined with analytics and Artificial Intelligence (AI) from IBM to identify the highest priority feeders and spans in the network.
Managing Vegetation
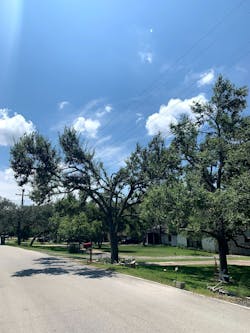
PEC, based in central Texas, is the largest electric distribution cooperative in the United States with nearly 8100 square miles of service territory and more than 19,000 miles of overhead electric lines in an area commonly known as the Texas Hill Country. Much like other utilities, PEC manages the challenges of a vast geography and a variety of environmental conditions, including limestone and granite soils, grasslands, low growing brush and varied species that each could be treated differently.
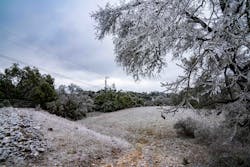
These include oak, pecan, hackberry, ash juniper and even mesquite. Environmental conditions range from extreme heat and dryness, which can increase wildfire risks, to tropical events and even icing, as experienced in February 2021 with Winter Storm Uri.
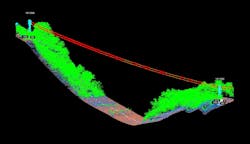
Geiger-Mode LiDAR, an efficient and high-performance mode of data collection, is the workhorse behind the highest value insights, offering some of the most precise measurements of vegetation encroachments available. This imagery, integrated into the right analytics environment, offers electric utilities managing immense territories and challenging environmental conditions the opportunity to know with confidence where they have the greatest risk to their network. PEC is using an IBM technology-based application to combine this new form of high-resolution point cloud data (30 points per square meter) and multi-spectral satellite data, along with environmental factors such as wildfire conditions and severe weather, to know which vegetation encroachments matter the most.
Using this technology, PEC is optimizing its resources based on trustworthy, condition-based insights. The cooperative’s network reliability, which is already above industry averages, continues to improve as a result.
Current Practices
Hundreds of interviews with utilities across North America, and indeed most of the globe, reveal that the most common approach to maintaining distribution corridors is by cycle. The second most common method is based on reliability metrics. Many electric utilities respond with vegetation maintenance based on outage data, a sort of prioritization by tree-SAIDI (System Average Interruption Duration Index).
Introduction to Technology
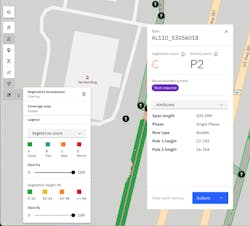
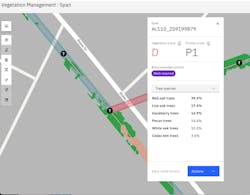
To address these challenges, PEC embraced an IBM technology, which uses remote sensing to provide condition-based insights for the use in both planned and reactive maintenance activities. Based on the utility line clearance maintenance specifications from PEC, IBM calculated a scoring system using Key Performance Indicators (KPIs), which account for both the condition of vegetation and the priority the area of interest should receive. The KPIs can include anything the co-op determines are key drivers of high-priority work and pose a risk to the reliability of the network. For PEC, these KPIs included three-dimensional distance to a conductor, volume of trees in the corridors that are within pre-determined range of the conductor height, tree species of interest and even a financial calculation of whether the resultant maintenance would require a climbing activity or the use of a bucket truck. From the KPIs, PEC determines a vegetation score.
The vegetation score was determined to follow a letter grade of A, B, C or D based on three-dimensional distances to conductor of 9+ ft (A score), 6-9 ft (B score), 3-6 ft (C score) and 0-3 ft (D score). In other words, the highest-risk segment due to the closest encroachment was a D score based on the risk of vegetation contact of 0-3 feet. The Priority score (P1, P2, P3, P4) is designed to accommodate for the incorporation of the vegetation score (A, B, C or D) combined with priority variables like population, criticality of the area served and even wildfire risk, using a Wildfire Risk model.
Scoring is further enhanced by analytics, which can include things like maintenance data to refine an initial score. For example, a D score, once maintained in the field, can be reverted to an A score in the application. For each of the scores, especially those scores deemed highest risk like D and C vegetation condition scores, a monetary value can be assigned. All this data is hosted, analyzed and displayed with a tool set called IBM Environmental Intelligence Suite.
Early Results
In the first two years of the project, PEC began a well-thought-out plan to make use of high-resolution spectral satellite data for vegetation encroachment scoring. The co-op also began an effort to tag roughly 200,000 tree species across its overall service territory. Not only would targeting areas for high-priority work due to potential encroachments help transition PEC from the cycle-based to condition-based approach to maintenance, but the cooperative also wanted to know where certain species were located to better plan for removals of hazardous trees. This transition allowed PEC to create a program where some of the maintenance on species with timing considerations like oak wilt could be deferred to the most appropriate time of year.
When PEC first introduced the technology and satellite data, the co-op immediately saw the value of it. With satellite maps and AI technology, PEC was able to move away from a cycle-based program to a targeted approach. This allows the co-op to see the entire area and create a plan to proactively prune trees before they create an outage.
Challenges to the Early Technology
One problem with satellite data is the two-dimensional nature of the imagery. This leaves some gaps in accuracy when a high-precision KPI is required to direct millions of dollars of maintenance budget towards condition-based work.
Satellite data makes use of multi-spectral analytics to detect vegetation using Normalized Difference Vegetation Index (NDVI) and other elements and then “estimate” tree heights using AI modeling. Reasonable accuracy can be achieved with tree heights, but that is only half of the equation. To achieve high levels of accuracy, the program must predict not only the height and shape of vegetation, but also must also know exactly where the poles and conductors are located in the X, Y or Z plane to derive the proximity of vegetation to assets. The analytics to measure these encroachments between trees and conductors are executed in the GIS environment, and because satellite data cannot detect poles and conductors with great certainty, especially in overgrowth situations, some error is introduced. Even with highly accurate GIS data, as was the case with PEC, conductor heights were still estimated based on pole heights, which do not capture line sag or pole lean with certainty.
Additionally, satellite data tended to struggle with certain types of directional pruning such as “V” cuts or “L” cuts, when trees were under the lines and existing acceptable clearance was indistinguishable, making the accuracy somewhere between 70-80%. The same condition would be even more true with overhang scenarios.
The Resolution
PEC and IBM required an improved source of imagery for the primary use case of high-precision vegetation encroachment detections. LiDAR was not generally considered as a viable imagery source for this case due to the immense costs incurred over lengthy distances in electric distribution. Time to insight, caused by abnormally long collection and processing times, was also an issue. Most often LiDAR assumes a role in vegetation maintenance when the use
cases for engineering can offset the immense investment, as often seen in transmission.
When PEC learned about the option for Geiger-Mode LiDAR, the necessary source of imaging began to emerge. Not only was this form of LiDAR accurate to within a foot, it was also able to be collected rather quickly (compared to traditional forms of LiDAR), and would provide the necessary detection of poles and conductors in addition to managing the physical shape of any form of direction pruning, like V-cuts, L-cuts and even overhang due to some capability with canopy penetration and side-imaging. Commercially speaking, Geiger-Mode LiDAR was offered at a fraction of the cost of traditional LiDAR sources. This new imagery increased the accuracy to greater than 95%. Instead of a two-dimensional image, PEC was able to use a three-dimensional image, enabling pruning contractors with an exact location.
PEC’s investment is already paying off in other business areas. For instance, PEC used the data to calculate the height of certain voltages of conductors above specified bodies of water. Another use case recently completed was for “Last Mile Fiber” allowing the Transmission Control Center to identify specifications on towers fit for hosting fiber and ensure NESC clearances are met without having to deploy personnel to the field.
“Following Winter Storm Uri in February 2021, most Texas utilities began to double or even triple their vegeta-tion maintenance budgets,” said Randy Kruger, PEC chief financial officer. “Having invested early in this technology, PEC is ahead of the curve, and already experiencing a considerable benefit of about $2.5 million per year. We’re pleased in our results and confident our investment will continue to benefit PEC and its members for years to come. Over the next 10 years, we expect the cooperative to save up to $25 million while also improving safety for our lineworkers in the field and reliability for our members.”
Condition-based vegetation insights can help distribution companies better manage their budget and resources to target the highest risk areas in their network. Investments may result in improved reliability, increased cost savings, safer workers and happier customers. Technologies are available today that can help distribution companies start this journey, and PEC has experienced firsthand how investments in this space help customers, employees and the bottom line. The utility that has the best chance to succeed is one that has leadership support to embrace technology, alter work-flow processes to accommodate for previously undiscovered intelligence and finds the right technology partner to see the organization through the transformation.
George Leader ([email protected]) is PEC vegetation maintenance manager. He has more than 40 years in the electrical industry, most of which was spent as a lineman working at an IOU, a municipality, and two cooperatives — all in Texas. The last 12 years he has built and managed the vegetation program for Pedernales Electric Cooperative. He is an ISA-Certified Arborist TX-3977A.
Penny Swanner ([email protected]) is the PEC vegetation maintenance supervisor. She has more than 12 years of experience in vegetation management and eight years of experience in the electrical utility industry, working at PEC for six of those years. She graduated with a Bachelor of Science in Forestry from Stephen F. Austin State University and is an ISA-Certified Arborist Utility Specialist TX-4108AU.
About the Author
George Leader
Distribution/Vegetation Management Supervisor
George Leader is distribution/vegetation management supervisor at Pedernales Electric Cooperative Inc. in Johnson City, Texas, responsible for all aspects of planning, budgeting and implementation of the PEC vegetation management program. An International Society of Arboriculture certified arborist, Leader brings more than 36 years of experience in T&D system maintenance. Prior to joining PEC, he was the head lineman at Houston Lighting & Power (CenterPoint).
Penny Swanner
Penny Swanner ([email protected]) is the PEC vegetation maintenance supervisor. She has more than 12 years of experience in vegetation management and eight years of experience in the electrical utility industry, working at PEC for six of those years. She graduated with a Bachelor of Science in Forestry from Stephen F. Austin State University and is an ISA-Certified Arborist Utility Specialist TX-4108AU.
