“Seeing the forest for the trees,” the classic admonition to not let the detailed, close-up view of a situation obscure “the big picture” perspective, is an apt one for the current state—and implications of—vegetation management at electric utilities. It’s also the perfect entry point for discussing the transformational role of data and AI in first assessing, then acting on, risk, particularly through the lens of cost.
Vegetation management is a “forest” of cost. It is literally one of the biggest, if not the biggest, annual O&M expenses at electric utilities, and it is unrelenting. Trees keep on growing, and they keep interfering with the reliable flow of power. In fact, tree-related outages are often the number one cause of power loss across the sector.
In a survey E Source delivered during a recent vegetation management webinar, utilities testified to the ongoing centrality and expense of vegetation management in their operations, revealing annual vegetation management budgets ranging from $5 million to $450 million annually—and even larger budgets exist. Whether your utility is at the low or high end of this range, as a percentage of your O&M budget, vegetation management likely sits at, or near, the top.
Given the high cost of vegetation management and its outsized impact on electric utilities’ reliability metrics, what is the central tenet guiding its execution? If you said “cycle” or “cadence,” you’d be correct.
Cadence-based vegetation management practices make a lot of sense. Trees have growing seasons—predictable ones—and linking tree trimming and removal to those natural rhythms is a great starting point – it just can’t stop there.
The good news is that we no longer have to. Today, cadence-based vegetation management processes can be enhanced and optimized—with the help of data. And in that optimization, you are bound to find dollars—dollars that can be re-invested in additional reliability-improving measures or stretched to give you the biggest bang for the buck for every vegetation-management dollar you do have.
A Lesson in Risk
Before moving on to the state-of-the-art in AI and vegetation management, let’s take a closer look at risk. Risk is the primordial pool from which all safety and reliability measures spring. Whether talking about vegetation management, wildfire risk mitigation, storm-outage prediction or adding avian guards, every dollar invested in improving the reliability of the grid is really an exercise in risk management.
This all hit home after working with an electric utility with a chronically poor-performing circuit. Year after year, big O&M budget dollars were poured into fixing this underperformer, and year after year it remained the worst-performing feeder. As a result, E Source’s Science Squad discovered, as did the utility’s executive sponsor, that some problems weren’t fixable—or perhaps better put, would never be worth the price of fixing.
Trying to get an inherently “unfixable circuit,” perhaps one that is extremely long and exposed to harsh conditions, to perform much better is akin to a football team working to make its slowest players faster. Well-intentioned, perhaps, but problematic. Those slowest players are most likely all offensive linemen—they just aren’t fast, and they aren’t going to get much faster no matter what the team tries.
For example, the utility with the poorly performing circuit shifted to a risk-based, data-driven approach that included focusing tree-trimming dollars on areas that would move the reliability needle most. As a result, it recently won an award for best vegetation management practices, ones that improved reliability without increasing O&M costs.
So how can you use data to become more like that award-winning utility? It’s a two-step process. First, you must find the areas of highest risk on your grid. Then you need to decide how to act on that risk.
Finding the Risk
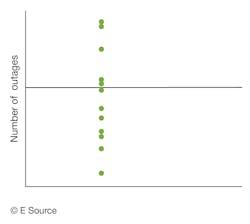
To optimize vegetation management decisions, electric utilities need to first identify where there is risk on the system. Traditionally, and as we saw in the example above, the way that reliability, outages, and risk are most often viewed by utilities can be summarized in the following chart.
In it, each green dot represents a feeder that has a certain number of outages per year. A line then gets drawn separating the “good” from the “bad” performers; i.e., anything above the line has the most outages and is thus a “bottom feeder.” And, intuitively, these worst performing feeders typically get the most attention, the most investment towards trying to improve the safety and reliability of these particular circuits.
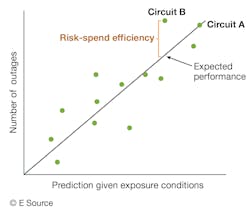
But there is a better way. By applying data science to this legacy approach, it’s possible to understand the expected performance for each of these circuits, predicting the number of outages based on risk and exposure to things that can't be changed through management decisions like the length of the circuit.
Consider two circuits. One that's long, the other short. All else being equal, a long circuit will typically have more outages than the shorter circuit due to more exposure. Armed with this understanding, we can then use data science to predict performance on the system, mapping actual performance of each circuit, sub-circuit or span to say, “how is this circuit performing against its expected performance?”
That leads us to what I call “risk-spend efficiency.” Risk-spend efficiency is the value that can be captured by trying to change and improve performance. For example, consider the circuit in the top right corner (“Circuit A” in Figure 2). It's one of the two worst-performing circuits and has the SADI and CADI metrics to prove it.
But here’s the rub. It’s actually performing as well as expected. (It happens to be a long, exposed circuit.)
Put another way, if we were to invest additional time, effort and dollars into trying to improve the safety and reliability of the system by concentrating on this circuit, we would be unlikely to get a good return on that investment.
Now follow the line from the upper right down to the lower left. There are several circuits here above the expected performance line that are “not-as-bad” performers as the highest-outage circuits if just counting the historical number of outages, but they, along with “Circuit B,” actually present the biggest opportunity for the utility to target investments that move the needle on reliability. In other words, they offer a better bang for the vegetation management buck. (That’s because when you act on those trees on that circuit, reliability metrics actually improve.)
Bring on the Data
The delta between expected and actual performance is setting the table for more advanced data science and AI.
It’s time to build a digital replica of your grid. In the case of E Source, this digital replica gets very granular, with the potential to be defined—based on each utility’s unique operations and needs—by more than 400 data points that will help you see and model risk. These more than 400 variables include utility data such as historical outages, maintenance history, inventory attributes and GIS system data combined with remotely sensed data such as that from LiDAR and satellite imagery, as well as with best-in-class third-party data spanning geographic and topographic data (slope, terrain and hydrology) and weather history.
All of this data gets fed into the model of the grid, which, through advances in machine learning, continues to process the data and improve over time. The result is a digital replica capable of scoring risk across both the entire system and more granularly—feeder by feeder, span by span and even tree by tree.
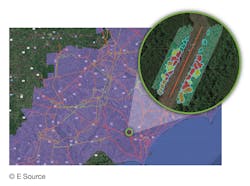
Think of the digital replica as a system-wide viewfinder with a telephoto lens, all built on risk. We can zoom in very granularly to make tree-level predictions, using the full arsenal of outage, geospatial, weather and maintenance data to assign a risk score for each polygon or point. And from there we can aggregate risk up throughout the system, with each polygon or point tying to a span, each span to a circuit, and each circuit to the whole transmission or distribution system.
This is a radical re-writing of risk calculation, one offering breadth, depth and newfound accuracy rooted in the transformational power of data.
Seeing and Acting on Risk
This newfound ability to see risk at a more granular level enables utilities to take unique, beneficial action on their system in a way that is conducive with their current vegetation management approach.
What does this look like in practice? A utility that already has specific feeder inspections planned for a certain year may sort by the high-risk feeder to prioritize the most valuable work first. Conversely, “double-clicking” into non-planned high-risk areas may reveal sub-circuit pockets of concentrated risk, so an off-cycle vegetation-trimming program could start there.
This whole data-driven approach really gets down to how utilities can optimize their spend and reduce their risk. Or, put another way, how they can use these data-driven insights to apply their unique vegetation management programs where they will deliver the most bang for the buck.
The answer to these questions is often manifested in historically overlooked circuits, ones that were never worst performers using traditional analysis but that are actually performing worse than what the predictive model thinks can be achieved. These are the “diamonds in the rough” where utilities can spend relatively small vegetation-management dollars to drive the biggest system reliability and safety improvements.
And this is where solely relying on cadence-based vegetation management can strain allotted funds. E Source’s modeling often shows a lot of low-risk work eating up large amounts of O&M budgets. Fortunately, when utilities see this, they often have the opportunity to pivot, ratcheting down some of the low-risk work and re-allocating the budget to where they’ll get the biggest reliability return.
The key here is that the risk-based model isn’t replacing the cadence-based process, it’s informing it. Sometimes the answer is simply adjusting the intensity of the normal cadence. Other times it’s prioritizing, or re-prioritizing, the order or starting point.
Recently, a utility using this data- and risk-based approach overlaid its system risk score over the planned cadence process. It saw that 4% of its high-risk grids represented more than 28% of its total expected outage duration. This insight enabled the utility to take its planned 800 circuit-mile off-cycle trim budget and focus it instead on the 180 circuit-miles of risk on the system, a nearly 80% reduction in targeted trim miles, all while improving grid reliability.
This is the new optimization awaiting electric utilities, and it’s ready now to make O&M dollars go further, and reliability metrics improve, across the transmission and distribution grid.
