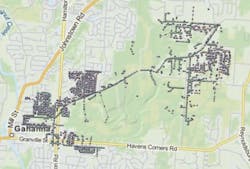
Recent years have seen an explosion in new technologies and policies that impact electric utilities, from the adoption of demand management tariffs to the integration of alternative energy sources. In 2009, the U.S. Department of Energy selected American Electric Power (AEP) Ohio to implement a smart grid demonstration project for a portion of the utility’s service territory in northeast central Ohio.
With various technologies being tested in a targeted market over a four-year period — including volt/volt-ampere-reactive optimization (VVO), energy storage, demand response and electric vehicle chargers — the intention was to simulate how these technologies would impact or affect the overall grid if fully deployed throughout AEP’s service territory.
Many Questions
To understand the potential impact of these technologies, AEP Ohio needed extremely detailed distribution circuit planning models that incorporated dozens of options in technologies, devices and operating policies. There are potentially hundreds of scenarios that come to mind in which the different options could be combined: What happens if the electric vehicle market share triples? What if 50% of customers start using consumer demand-management technologies? What if a significant increase in renewable energy integration is seen? What if all of these things happen at once, are the effects cumulative or do they cancel each other out in unexpected ways?
AEP Ohio designed a numerical experiment that would answer these questions and more using modeling and simulation. For the experiment, the utility identified five demand-response tariffs and five equipment-based technologies to evaluate. Each of these 10 technologies was assessed to find their individual impact on the grid. Additionally, many of the technologies were combined to identify whether they behaved synergistically or resulted in degraded performance.
Within each technology study, a parameter space and settings were chosen for each technology to vary, which was used to both interpolate and extrapolate the effects of the smart grid technologies. In addition to selecting these technologies, AEP also identified, for the numerical experiment, 32 circuits that represent 94% of the approximate 1,700 circuits in the service territory. All of the circuits were classified as one of 12 circuit types, based on 10 circuit characteristics. This categorization and sub-selection of feeders allows for the results from these 32 feeders to be scaled and applied to all AEP Ohio feeders.
Modeling the Answers
AEP Ohio decided to use GridLAB-D, an open-source grid modeling program, to calculate the power flow for each circuit modeled in the experiment. This modeling software supported incredibly detailed analysis of the project: everything from the substation to the meter and everything in the house, including appliances, lighting load, plug load, heating, cooling and more. Gathering all of the data to accurately define these objects took about four to five days using existing tools. Given the scope of the numerical experiment, this was far too labor intensive. AEP worked with Battelle to form a solution that simplified and reduced model building time.
The new modeling tool, now part of the Battelle Grid Command software suite, improves the efficiency of building full circuit models. Grid Command gives users an easy-to-use interface that sits on top of the GridLAB-D calculation engine. It imports the baseline data from existing databases and then automates the model building process for users. The idea was to allow models to be built, parametric studies to be set up, and data to be analyzed in an efficient and consistent way.
Each of the 32 distribution circuits was calibrated against a full year of supervisory control and data acquisition (SCADA) data. From this numerical experimental design, an additional 1,250 simulations were identified to study each of the smart grid technologies. Each scenario was built efficiently using an improved, simple wizard interface that lets users select from a wide range of possible configuration options. Since AEP was testing these advanced technologies for only a small portion of the service territory, it needed to be able to evaluate a variety of different scenarios. The software allowed exploring the various alternatives at a very detailed level, and it enabled seeing how different combinations of technologies would affect each other and impact the system as a whole.
Basis for Moving Forward
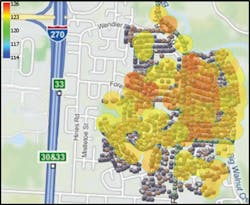
The data analysis and visualizations helped AEP Ohio to simulate the impacts of a new technology or energy source integration, policy changes and operational decisions. The heat map feature in the software allows users to look at data from multiple model objects simultaneously. For instance, circuit-voltage profile values can be displayed for multiple objects in the model. The resulting heat map can be used to quickly determine whether simulation results were outside the expected value range for a given characteristic, for example, power or voltage. Additionally, this feature provides the ability to verify the models were run correctly and the appropriate results were obtained.
Since beginning this project, hundreds of scenarios have been set up and run. The effects of single and combined technologies have been examined on 32 distribution circuits. Additionally, the tool has been used to analyze all of the data generated from these scenarios. This simulation project has generated more than 6 TB of output data that has been analyzed. AEP has benefited from the simulation results developed during the implementation of the gridSMART demonstration project. As a result, AEP Ohio will consider the output from this analysis as it moves forward to expand proven technologies in other parts of its service territory.
Brian Schell ([email protected]) is a principal engineer in the grid management deployment organization of American Electric Power in Columbus, Ohio, U.S. This organization manages the deployment and implementation of smart grid projects, including volt/volt-ampere-reactive optimization, distribution automated circuit reconfiguration, and modeling and simulation. Before his involvement in grid management deployment, Schell worked in the distribution system planning organization at AEP. He holds a BSEE degree from West Virginia University and is a licensed professional engineer in Ohio.
Companies mentioned:
American Electric Power | www.aep.com
Battelle | www.battelle.org
Sidebar: Use Analysis Examples
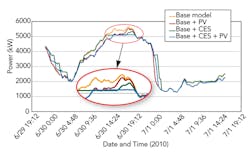
The synergistic effects of combining two smart grid technologies, solar and a fleet of small 25-kW batteries, was evaluated. The analysis included baseline model data for the circuit being analyzed, then with solar (photovoltaic [PV]), then with batteries (community energy storage [CES]), and finally with both technologies.
For the battery scenario, a fleet (131 batteries) of centrally controlled 25-kW batteries was deployed on a circuit and operated in a peak shaving mode. In the PV case, 131 25-kW residential solar panels were deployed on the circuit. The combined case used 131 batteries and PV panels. The CES fleet by itself did not have sufficient energy to shave the entire peak. Likewise, the PV array output was not sufficient to shave the peak. However, the results showed the combination of the two technologies had more than enough power to reduce the peak.
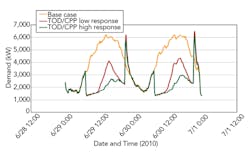
This project also looked at the benefits of implementing demand-response tariffs. Specifically, various levels of customer participation in time-of-day/critical-peak-price (TOD/CPP) tariff was modeled. The model could vary user response to CPP events, which are actually heating or air-conditioning setting adjustments, to reduce energy consumption during the events. The results show a significant shaving of the peak. However, they also show a significant rebound effect associated with these loads coming back.
The rebound was greatly exaggerated by simulating 100% tariff penetration levels, and the effect was lessened at reduced tariff penetration levels. The simulation provided the ability to scale results between 0% to 100% penetrations. The analysis examined a comparison of low-response versus high-response customer groups. Both have a similar rebound effect, but the high response obviously shaves significantly more peak.

