Exactly how quickly the electrification of transportation is ramping up is still an open question. Electric vehicle (EV) adoption projections vary widely, with sources suggesting EV sales’ market share could reach anywhere between 35% and 50% by 2030. According to the automotive research and intelligence firm Wards Intelligence, EVs already represented 11% of light-duty vehicle sales in the United States in 2021.
Though aligned with aggressive decarbonization and electrification goals, these uptake rates pose a challenge for utilities. As EVs gain market share and lawmakers deploy EV-friendly policy to accelerate adoption, utilities must prepare for unknown increases in residential loads due to EV charging. Accommodating the added load could entail changes to established design parameters.
To better understand the impact of increasing EV loads on residential transformers — essential for stepping distribution voltages down for residential end use — our team at POWER Engineers used CYME 9.0 to perform quasi-static time series analysis on a realistic distribution model from the National Renewable Energy Laboratory (NREL). That, in turn, demanded developing a method for forecasting and creating residential EV charging time series profiles for use in the analysis.
Using these tools, we evaluated changes in diversity factor, load factor and average residential load associated with EV charging. We also identified likely transformer upgrades needed to safely incorporate EV loads into established residential distribution systems. This supports a wider consideration of current transformer sizing procedures with respect to EV loading growth.
Assets like transformers are expected to last 20 to 30 years or more. With EV market share growing year after year, understanding the impact of the associated load changes — and the methodological improvements or technological upgrades needed to accommodate them — is of critical concern for
utilities and stakeholders.
Together with record transformer demand and ongoing supply chain bottlenecks, these changes in consumer habits put a premium on accurate, cost- and resource-conscious transformer sizing for current and future deployment. This analysis of NREL’s model facilitated a more precise understanding of the impact of EV loads on residential transformers, which will allow planners to develop more robust design practices to guide pivotal upgrade decisions with EV adoption growth in mind.
Study Assumptions
Developing realistic charging profiles is difficult. To date, studies aimed at building realistic EV load profiles often rely on small sample sizes from a handful of cities. Though foundational first steps, these studies afford limited insight for variable, evolving habits across regions and demographics. A scarcity of reliable data also complicates modelling. Public chargers often collect data on car type and charging duration, but these are likely not the primary charging port for most EV consumers.
For example, EPRI reports that 80% of charging occurs at home, where 240 V outlets often do not collect data. Most home charging data comes from smart meters provided by entities with private agreements with their customers. This information can be used to model specific locations, but may not support realistic, reliable conclusions for utilities that want to understand EV charging in other areas.
Compensating for these challenges demanded assumptions. For the purposes of our study, residential loads were identified as EV charging locations based on low, medium, high, and medium time-of-use adoption cases, with 70% of charging locations assigned a battery electric vehicle with a 68.4 kWh capacity and 30% assigned a plugin hybrid electric vehicle with a 13.5 kWh capacity. Level 2 chargers with a 7.2 kW charging rate supplied the EVs.
To figure out what time of day a customer begins charging their vehicle, we used probability density functions from both the BEV and PHEV. This gave us the probability a customer would start charging their EV based on their current battery level or state of charge (SoC). Once a customer began charging based on their SoC, the second probability function was used to assign them a charging start time within the model.
Based on the average kWh/mile rating of two common EV models (Tesla Model X and Chevy Volt), we assigned BEVs an average discharge rate of 9.4 kWh/day (ơ=10.25 kWh/day) and PHEVs an average discharge rate of 0 kWh/day (ơ=7.3 kWh/day).
Testing
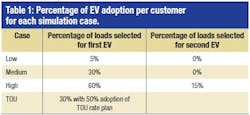
To assess the likely impacts of increasing EV adoption and associated charging loads on residential transformers, datasets from NREL supplied a test bed to implement residential EV loads in a realistic but synthetic distribution model. We performed quasi-static time series (QSTS) analysis of residential EV charging time-series data created in Python 3 for three levels of EV adoption — low (5% EV adoption per customer), medium (30% per customer) and high (60% per customer).
Each customer received a PHEV, BEV or no EV based on the outlined adoption rates (low, medium, high). 365 days of loading was simulated with a unique 15-minute resolution loading profile for each customer. The SoC-based probability density functions discussed above were used to decide customer charging habits. If a customer charged their EV on a given day, we used the probability density function to create normalized weekday and weekend time profiles to determine when the vehicle starts charging. Shifting the weekday probability of charging start time to peak at 23:00 without modifying the weekend charging profile allowed us to also evaluate a TOU plan.
To see the impacts of EV loads on residential transformers, we used the feeder topology. JSON placement files provided with the NREL data defined distinct levels of adoption and EV load placement. The high adoption rate case includes a possible second EV at some residences. The models defined residential customer time-series load data as a percentage of total possible load in 15-minute intervals over 365 days, with the EV charging load profiles added where EVs were assigned. A Python script compared customer time-series load profiles with the total load seen on the transformer high side and supplied the diversity factor for each transformer over the entire 365-day period.
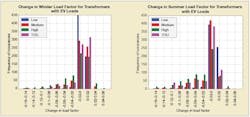
To relate the change in diversity factor to transformer loading, we calculated the seasonal (summer and winter) load factor for each transformer. To fully understand the effects of the increase in EV loads on overall residential transformers loading, we developed a function to determine transformer damage likelihoods based on percentage of loading over nameplate rating and the amount of time at that rating (defined based on criteria set out by Eaton for single-phase, dry type transformers, as required by ANSI).
Transformer loadings, integrated over 12 hours, which surpassed this function were considered indicative of potential damage. Though the criteria used to develop this function do not account for all relevant variables, it nonetheless provides an informative — if simplified — view of potential transformer damage based on EV load.
Results
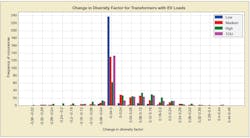
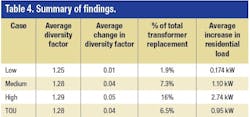
In all adoption cases, the vast majority of transformers saw an increase in diversity factor. Broadly, more EV loads lead to higher diversity factors. With a high rate of EV adoption, 60% of transformers experience a diversity factor increase while 21% see no change. Current transformer design practices that size transformers based on a set diversity factor should be adequate in over 81% of cases, requiring no change up to a high EV adoption percentage. Indeed, in 60% of cases these practices could even be conservative, leading to underused transformers.
The transformer failure function discussed above determined the number of transformers that might be damaged by increased EV loads. The function does not guarantee failure, but does indicate that damage has likely occurred, increasing the chance of future failures.
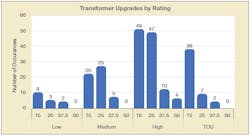
To mitigate the potential for damage, we also assessed transformer upgrades. The medium and TOU adoption cases respectively required 50 and 45 upgrades across 688 studied transformers to remove failures that exceeded the transformer failure function. The high adoption case took 110 upgrades to mitigate all potential damage, representing 16% of studied transformers.
Under the high adoption scenario, we found a 2.74 kW, 19% increase in peak load compared to the base case. The medium adoption case saw a 7.6% increase in peak load over the base case. While the TOU adoption case required fewer transformer upgrades, there was little difference in residential load increases between it and the medium case. A 0.95 kW increase in the former and a 1.10 kW in the latter signals that TOU rates might not effectively reduce residential loads at higher adoption levels. These peak load increases are observable, but produce only minor changes in load factor across all adoption cases. Load factor decreased more sharply in summer than winter across all cases, likely due to increased peak loads.
Conclusions
With utilities currently focused on developing plans to accommodate increasing EV loads, evaluating the way transformers are currently being sized for new construction and routine maintenance could reduce costs and waste. Based on our findings, a 30% EV adoption rate could demand upgrades to 7.3% of transformers. At a 60% adoption rate, the number of transformers in need of upgrades increased to 16%.
Assuming that 30 million of the United States’ 50 million distribution transformers serve residential loads, 2.2 million transformers may need to be replaced to support the load increases associated with a 30% EV adoption rate. In our high adoption scenario, with a 60% EV adoption rate, that number increased to 4.8 million.
With efforts ramping up in many cities to reduce natural gas use for heating and cooking in favor of electrified alternatives, millions of residential transformers will likely need to handle increasingly large loads even absent a contemporaneous increase in EV loads. Climate change-induced consumer demand changes and policy prescriptions could also affect peak demand in the future.
Given ongoing supply chain issues and future uncertainty, considering ways existing design and planning methods can be modified to handle increasing levels of EV adoption is essential. EVs are an inevitable part of a decarbonized, renewables-rich society. The time to assess the likely impacts of an increasingly EV-saturated grid and plan for the safe, reliable integration of EV loads is now.
About the Author
Jodie Lupton
Jodie Lupton, E.I.T., is a distribution studies engineer with POWER Engineers. Her experience and expertise focuses on grid modernization projects like conservation voltage reduction, volt-var optimization, and system impact studies for distributed energy resource interconnections. In addition to her studies and automation work, Jodie has experience in underground and overhead distribution design. She holds a Bachelor of Science degree in electrical engineering from the University of West Florida.

