Shanghai Considers N-2 for Distribution Reliability
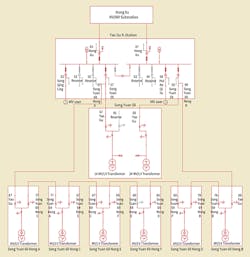
In downtown Shanghai, China, more than 1500 K-stations serve as the backbone of the medium-voltage 10-kV distribution network. A K-station typically is equipped with a single bus bar system divided into two sections. Supplied by a single incoming cable, each section of the bus bar can supply three to six outgoing feeders.
K-stations were introduced two decades ago as a way to expand the bus bars at 200 110/10-kV and 35/10-kV substations. Designed to withstand the loss of an incoming power source, K-stations have been essential to improving Shanghai’s distribution network reliability. In 2017, the distribution system achieved a 99.99% reliability milestone in the city center for the first time, largely because all major distribution system components satisfied the n-1 criteria whereby supplies are restored quickly in the event of a single component failure.
However, there is still room for improvement. In Shanghai, infrastructure investment drives local economic growth. The construction and reconstruction of roads, tunnels and other similar infrastructure often require planned distribution system outages for the maintenance or replacement of system components. These planned outages force the system frequently into the n-1 status and usually can take up to eight times longer than unplanned outages. During this time, the system is vulnerable to an additional failure.
To improve the existing distribution network reliability, grid managers in Shanghai are considering the feasibility and cost effectiveness of reinforcing K-stations to satisfy the n-2 criteria, sometimes referred to as the n-1-1 criteria in certain parts of the world.
K-Station Redesign
The n-2 criteria is not new to the electric utility industry. It is commonly used on transmission systems but rarely considered for distribution networks. The reasons for this mainly are because of the low probability of experiencing cascading contingencies and the large investment required.
To satisfy the n-2 criteria, K-stations will need more complex designs. Grid managers in Shanghai recently analyzed three design proposals for reinforcing the K-station network. The designs provide additional standby connections in addition to the sectionalizing circuit breaker. These additional connections would provide load-transfer capacity between K-stations and indirectly between substations, providing more backup routes for the K-station to obtain and supply power in an outage.
- Proposal A — Each K-station is supplied by an HV/MV substation with an outgoing MV feeder on each side of the bus-section circuit breaker, designated as a standby connection to a neighboring K-station. This interconnection has one end closed and one end open, and it can be energized to transfer power in either direction by a single switching operation.
- Proposal B — A K-station group is composed of two primary K-stations supplied by HV/MV substations and a limited number of secondary K-stations, which are interconnected and supplied by other K-stations. In the complete group, only two interconnections typically would be in standby mode.
- Proposal C — This is a similar arrangement to proposal A but the direct standby interconnections are replaced with indirect interconnections. Two feeders from adjacent K-stations are connected at the ends, thereby forming a ring-main. Typically, this ring-main is operated as an open ring, but the interconnecting cable has a current-carrying capacity capable of supplying the total load on one section of the K-station bus bar in the event of the open ring being closed.
Outage Conditions
In the event of a single outage, a K-station in proposals A and C would resort to the alternative source of power by isolating the failed circuit and closing the bus-section circuit breaker. However, in proposal B, the n-1 state adjustments would be optimized to prepare for a second outage. The standby connection would be activated to restore supplies, in which case all bus-section sectionalizing circuit breakers would remain open.
Because each bus bar section in a K-station has a bus-section circuit breaker and an additional interconnection as backup, there are several ways to operate the distribution network for an n-2 contingency. In proposals A and C, a K-station losing both sources of supply would rely on its neighboring K-stations on both sides. In this situation, the recommendation would be to transfer half the load to each neighbor to avoid overloads. In proposal B, the bus-section circuit breakers would go from open for the n-1 state to closed for the n-2 state.
K-Station Capacity
In compliance with existing standards in Shanghai, K-stations are supplied from HV/MV substations by two 750 MCM copper (Cu) cross-linked polyethylene (XLPE) insulated cables with a rated current-carrying capacity of 400 A. The current rating of the 750 MCM cable is set as standard at 400 A to take into consideration the derating factor applied because of the number and proximity of underground cables installed in Shanghai. Therefore, by traditional design, a K-station should support a total load or an assigned firm capacity of 7 MW.
The K-stations for proposals A and C are designed for a total demand of 7 MW, so the standby interconnection for proposal A should be rated to supply one section of the bus bar, namely 3.5 MW. The indirect interconnection in proposal C should be able to supply its own load plus 3.5 MW. Therefore, 350 MCM and 500 MCM Cu cables are recommended for each interconnection in each proposal.
In proposal B, the firm capacity per K-substation must be balanced with the number of substations in the group to avoid any overloads. If the capacity is 7 MW and the number of K-stations is three, two pairs of coupled 750 MCM Cu are recommended to supply primary K-stations, and regular 750 MCM Cu cables for secondary K-stations.
Reliability Analysis
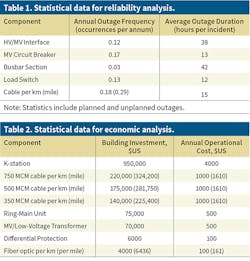
The reliability model applied to each proposal assumed evenly distributed load and all HV/MV substations and K-stations had similar installed capacity. Also, any adjacent HV/MV substations or K-stations should be equally distant as determined by the load density and installed capacity per station.
The key load density and substation assumptions were as follows:
- Load density ranges from 5 MW to 80 MW per sq km (12.95 MW per sq mile to 207 MW per sq mile).
- HV/MV substation capacity is 2 x 40 MVA, power factor 0.95, average load factor 65%, K-station maximum load 7 MW and average load factor 80%.
- Average time to operate a K-station remotely is three minutes.
- Remotely operating load switches on a feeder takes 5 minutes, whereas it can take 2.5 hours manually.
- 50% of the feeder load switches can be operated remotely.
- Outage of distribution components are mutually independent events.
Results of the Analysis
A power supply system can be considered a tree structure because there are multiple possible routes for current to flow from the tree’s leaves (HV/MV interfaces) to the root (load). Therefore, the three K-station proposals were subject to a recursion tree algorithm, as cited in paper 941, “Improve Reliability of the Urban MV Distribution System with K-station and Its New Network Designs”, at the CIRED International Conference and Exhibition on Electricity Distribution 2019. The results of the analysis indicated reliability would improve with increasing load density and, compared to the existing n-1 network design, both the average service availability index (ASAI) and system average interruption duration index (SAIDI) would be improved by the proposals. As the load density varies for 80 MW to 5 MW per sq. km. (207 MW per sq. mile to 12.95 MW per sq. mile), the annual SAIDI of the traditional design varies from 40.29 minutes to 46.08 minutes. Proposal A would be the most effective, reducing SAIDI by 2.35% (0.95 minutes) to 3.51% (1.62 minutes). Proposal C ranks the second most effective, with a SAIDI reduction of 1.76% (0.71 minutes) to 2.36% (1.09 minutes), while proposal B reduces SAIDI by 0.98% (0.4 minutes) to 1.77% (0.82 minutes).
However, none of the three proposals would succeed in reducing the annual system average interruption frequency index (SAIFI), which originally was 1.03 to 1.33 occurrences per annum. This index remains unchanged for proposals A and C but increases by 14.4% to 16.9% in proposal B.
Economic Analysis
The cost-evaluation analysis was based on the index annual cost per load (ACPL), the annual cost comprising the amortized investment and annual operational costs.
The cost of the distribution network generally gets cheaper as the load density increases. Unsurprisingly, the traditional design always is the lowest cost. The ACPL for proposal A would increase by 2.51% to 4.98% as the load density varies from 80 MW to 5 MW per sq km. Proposal B would increase the ACPL by 6.76% to 14.29% and proposal C by 1.66% to 3.86%.
Proposal A would be the most cost effective when the load density is less than 10 MW per sq km (25.9 MW per sq mile). Proposal C would be the most cost effective with higher load densities, leaving proposal B as the least cost effective distribution network design. Given the average load density in Shanghai is around 40 MW per sq km (104 MW per sq mile), for each additional U.S. dollar spent annually on each kilowatt in the model, the annual SAIDI is estimated to be reduced by 0.63 minutes (proposal A), 0.13 minutes (proposal B) and 0.87 minutes (proposal C).
Pilot Projects
The distribution network in Shanghai already has reached 99.99% reliability, so improving reliability further will require innovative network designs and a larger investment. The three network design proposals developed for K-stations to satisfy the n-2 criteria have been subject to reliability and economic analyses. The analyses indicate improvements in reliability can be achieved with an increase in investment.
Proposals A and C show cost-effectiveness benefits, so grid managers in Shanghai are launching pilot projects in 2020 to try these designs, with the ultimate goal of establishing a world-class distribution network in Shanghai.
About the Author
Ruochen Song
Ruochen Song received his bachelor’s degree from Shanghai JiaoTong University and master’s degree from Rutgers University. A senior engineer in the Shanghai Municipal Electric Power Co., Song has been responsible for leading the urban distribution network planning in Shanghai, China, for the last five years. Song is devoted to research on providing a highly reliable, sustainable, and intelligent electric power supply to all end users in Shanghai.
Jingjing Lu
Jingjing Lu is a planning engineer in the Shanghai Municipal Electric Power Co. in China.
Mingze Zhang
Mingze Zhang is a senior planning engineer in the Shanghai Municipal Electric Power Co. in China.


